
Videos
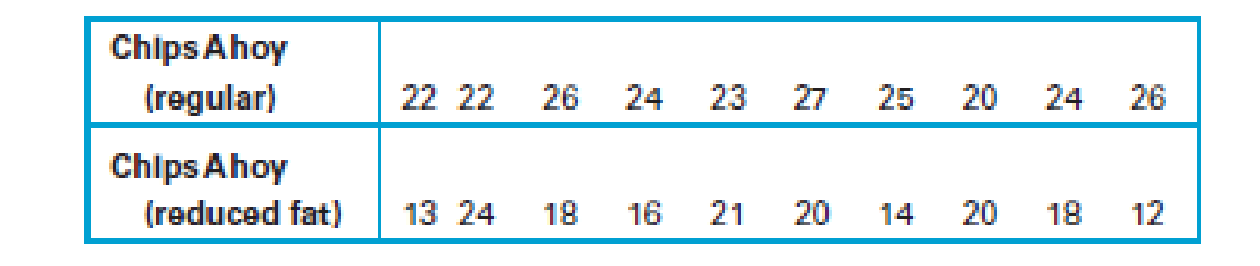
Chocolate Chips. Listed below are counts of the numbers of chocolate chips in two different types of cookies.
- a. Find the
mean and median for each of the two data sets. - b. Find the
range and standard deviation for each of the two data sets. - c. Use the same scale to construct a boxplot for each of the two data sets.
- d. Apply the range rule of thumb to estimate the standard deviation of each of the two data sets. How well does the rule work in each case? Briefly discuss why it does or does not work well.
- e. Based on all your results, compare and discuss the two data sets in terms of their center and variation. Does there appear to be a difference between the numbers of chocolate chips in Chips Ahoy regular cookies and Chips Ahoy reduced fat cookies?
a.
Compute the mean and median for the two data sets.
Answer to Problem 1CRE
The mean and median for the regular type cookies are 23.9 and 24 respectively.
The mean and median for reduced fat cookies are 17.6 and 18 respectively.
Explanation of Solution
Calculation:
The data represents the counts of the numbers of chocolate chips in regular and reduced fat cookies.
Mean:
The arithmetic mean (also called the average) is the most commonly used measure of central tendency. It is calculated by adding the observed numerical values of a variable in a set of data and then dividing the total by the number of observations involved.
The mean and median for the regular type cookies is obtained as shown below:
Software procedure:
Step-by-step procedure to find the mean using the EXCEL software is given below:
- Open an EXCEL file.
- Enter the data values from A1 through A10.
- In B1, enter the formula “=AVERAGE(A1:A10)”.
- Click Enter.
- Output using EXCEL software is given below:
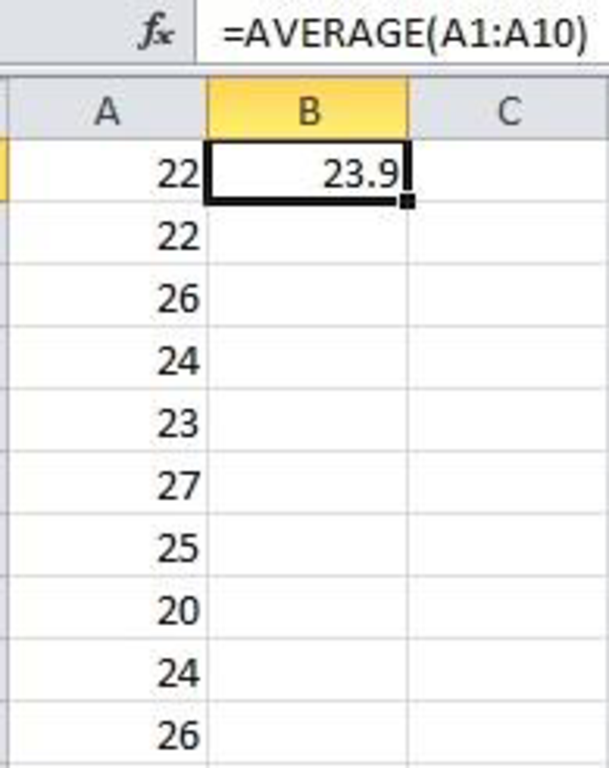
From the EXCEL output, the mean value is 23.9 chocolate chips.
Median:
The median is the middle most value of the observation. In case of no tie, half of the observations will be less than middle most value, and half of the observations will be greater than that value. In addition, the median is unaffected by extreme values in a set of data.
Software procedure:
Step-by-step procedure to find the median using the EXCEL software is given below:
- Open an EXCEL file.
- Enter the data values from A1 through A10.
- In B1, enter the formula “=MEDIAN(A1:A10)”.
- Click Enter.
- Output using EXCEL software is given below:
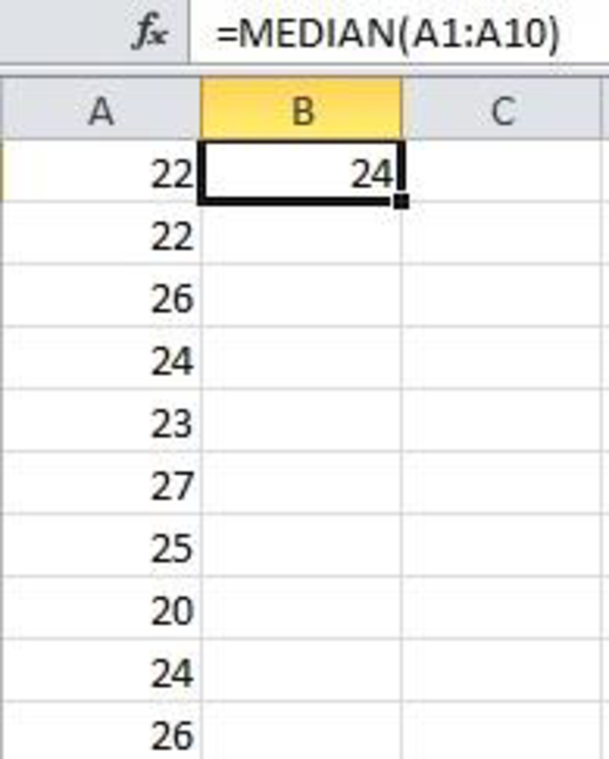
From the EXCEL output, the median is 24 chocolate chips.
Thus, the mean and median for the regular cookies are 23.9 and 24 chocolate chips respectively.
The mean and median for the reduced fat cookies is obtained as shown below:
Software procedure:
Step-by-step procedure to find the mean using the EXCEL software is given below:
- Open an EXCEL file.
- Enter the data values from A1 through A10.
- In B1, enter the formula “=AVERAGE(A1:A10)”.
- Click Enter.
- Output using EXCEL software is given below:
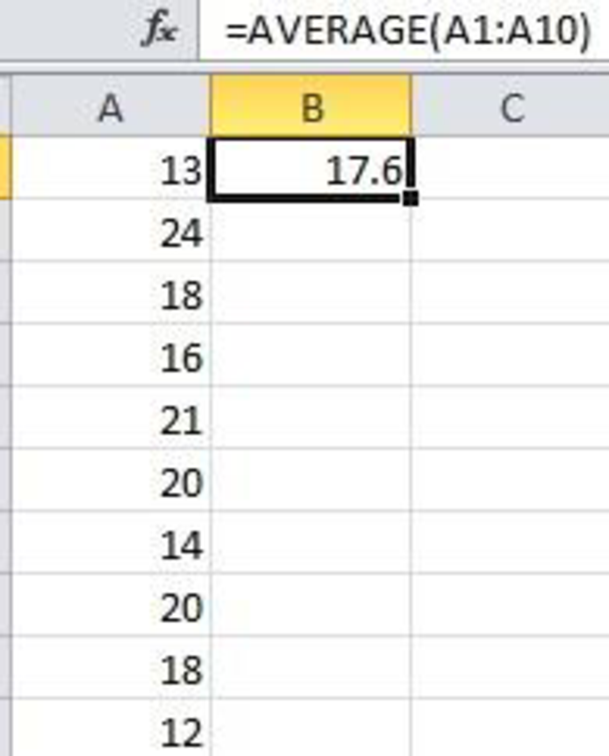
From the EXCEL output, the mean value is 17.6 chocolate chips.
Software procedure:
Step-by-step procedure to find the median using the EXCEL software is given below:
- Open an EXCEL file.
- Enter the data values from A1 through A10.
- In B1, enter the formula “=MEDIAN(A1:A10)”.
- Click Enter.
- Output using EXCEL software is given below:
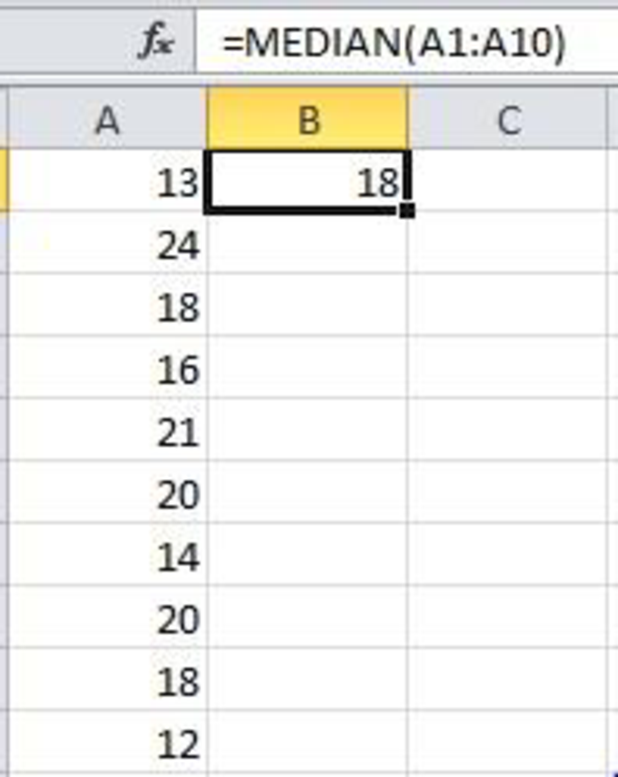
From the EXCEL output, the median is 18 chocolate chips.
Thus, the mean and median for the reduced fat cookies are 17.6 and 18 chocolate chips respectively.
b.
Find the range and standard deviation for the two data sets.
Answer to Problem 1CRE
The range and standard deviation for the regular type cookies are 7 and 2.2 respectively.
The range and standard deviation for reduced fat cookies are 12 and 3.8 respectively.
Explanation of Solution
Calculation:
Range:
The range is the difference between the largest and the smallest values in the data set. That is,
Standard deviation:
The standard deviation of a random variable X of size n is defined as,
The standard deviation measure the variability of a distribution.
The range and standard deviation for the regular cookies:
Here, the maximum value is 27 and the minimum value is 20. Thus, the range is,
Thus, the range is 7 chocolate chips.
Software procedure:
Step-by-step procedure to find the standard deviation using the EXCEL software is given below:
- Open an EXCEL file.
- Enter the data values through A1 through A10.
- In B1, enter the formula “=STDEV(A1:A10)”.
- Click Enter.
- Output using EXCEL software is given below:
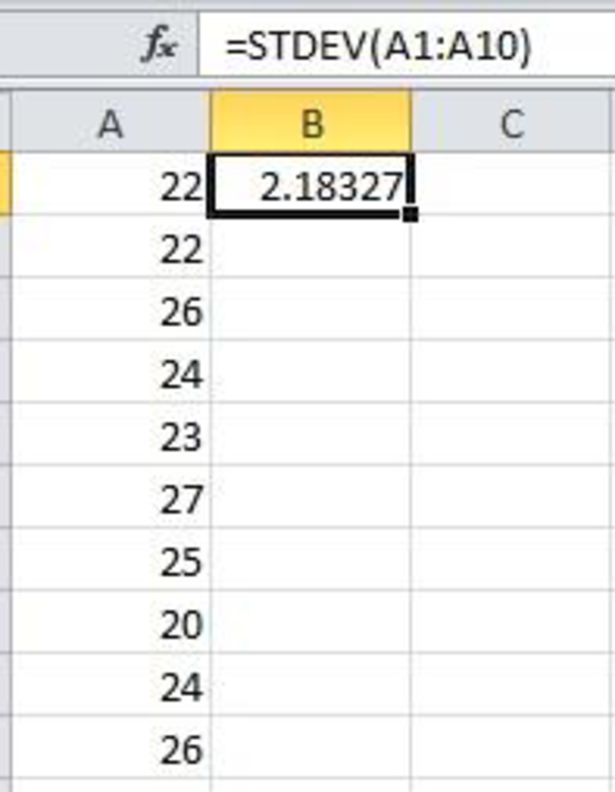
- From the EXCEL output, the standard deviation is 2.2 chocolate chips.
- Thus, the standard deviation is 2.2 chocolate chips.
Thus, the range and standard deviation for the regular cookies are 7 and 2.2 chocolate chips respectively.
The range and standard deviation for the reduced fat chocolate chips:
Here, the maximum value is 2.2 and the minimum value is 1.5. Thus, the range is,
Thus, the range is 12 chocolate chips.
Software procedure:
Step-by-step procedure to find the standard deviation using the EXCEL software is given below:
- Open an EXCEL file.
- Enter the data values through A1 through A10.
- In B1, enter the formula “=STDEV(A1:A10)”.
- Click Enter.
- Output using EXCEL software is given below:
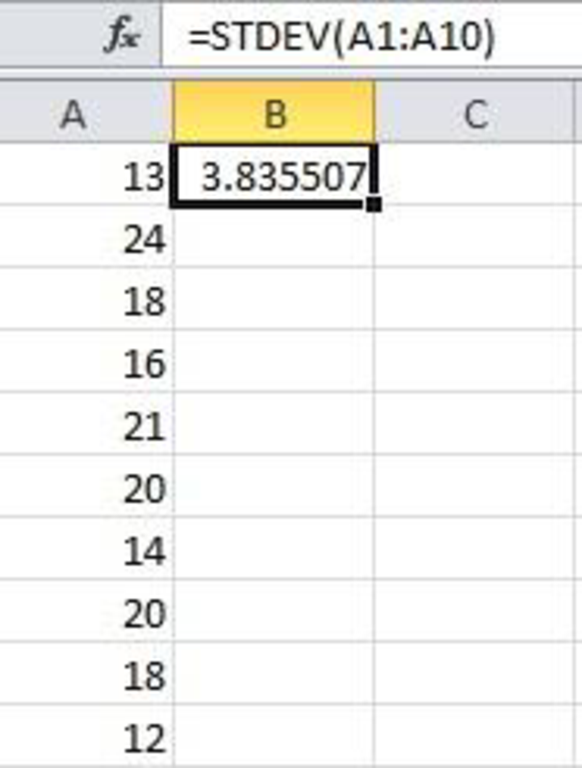
- From the EXCEL output, the standard deviation is 3.8.
- Thus, the standard deviation is 3.8 chocolate chips.
Thus, the range and standard deviation for the reduced fat cookies are 12 and 2.2 chocolate chips respectively.
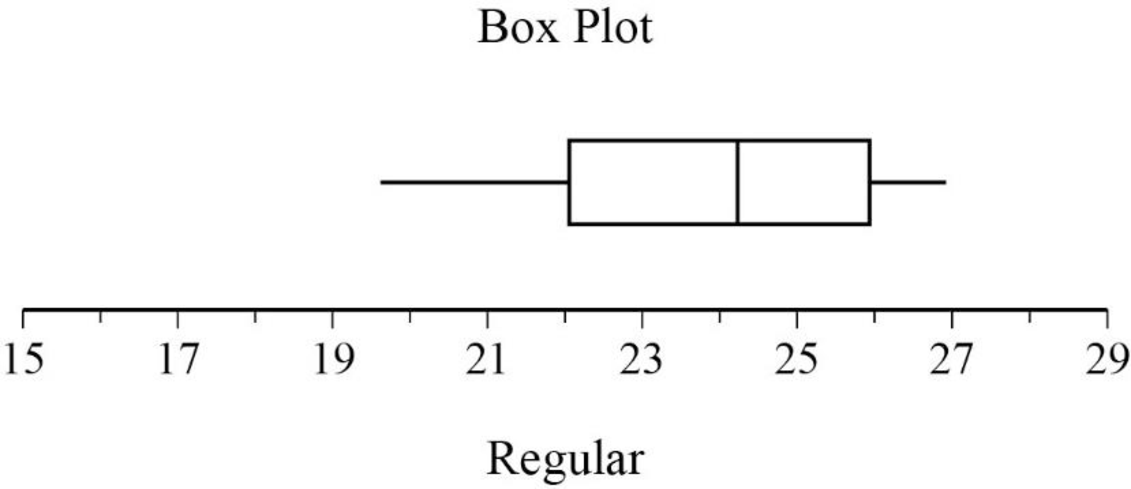
c.
Draw boxplot for each of the data set.
Answer to Problem 1CRE
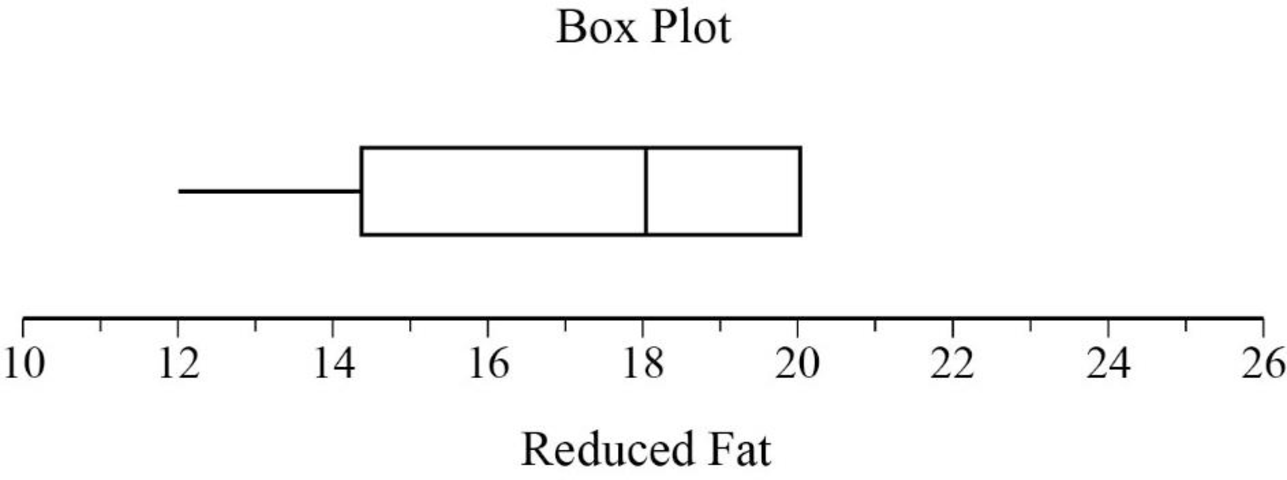
The boxplot for the two data sets is given below:
Explanation of Solution
Calculation:
Box-and-whisker plot:
A graph used to display five number summary is termed as box-and-whisker plot. It is also called as boxplot.
Graphical procedure:
Step-by-step procedure to draw box-and whisker plot is as follows:
- Construct a horizontal line that consists of the range of the data.
- Plot the five-number summary for regular cookies above the horizontal scale.
- Draw a box above the horizontal scale from
- Draw whisker from the box to the minimum and maximum entries.
Graphical procedure:
Step-by-step procedure to draw box-and whisker plot is as follows:
- Construct a horizontal line that consists of the range of the data.
- Plot the five-number summary for fat reduced cookies above the horizontal scale.
- Draw a box above the horizontal scale from
- Draw whisker from the box to the minimum and maximum entries.
d.
Find the standard deviation for each of the data set using range rule of thumb. Also check whether it worked or not and explain the reason.
Answer to Problem 1CRE
The standard deviation for regular cookies is 1.75 and for reduced fat cookies is 3 using the range rule of thumb.
The obtained standard deviations using range rule of thumb is close to the actual standard deviations.
Explanation of Solution
Range rule of thumb:
By the range rule of thumb, the standard deviation is approximately one by fourth of range. That is,
Range for regular cookies is 7.0. Thus, the standard deviation for regular cookies is,
Range for reduced fat cookies is 12.0. Thus, the standard deviation for reduced fat cookies is,
Thus, the obtained standard deviations using range rule of thumb is close to the actual standard deviations.
e.
Compare the two data sets in terms of center and variation based on the obtained results.
Check whether there appear to be a difference between the numbers of chocolate chips in Chips Ahoy regular and Chips Ahoy reduced fat cookies.
Explanation of Solution
The mean value represents the center and standard deviation accounts for the variation of the data set.
The mean value is 23.9 and 17.6 for regular and reduced fat cookies respectively. The standard deviation is higher for reduced fat cookies (3.8) than for regular cookies (2.2). Thus, the regular cookies are expected to have more chocolates than reduced fat cookies and the variation in the chocolate is less for regular fat cookies than reduced fat cookies.
There appears a difference between the numbers of chocolate chips in Chips Ahoy regular and Chips Ahoy reduced fat cookies.
Want to see more full solutions like this?
Chapter 4 Solutions
Statistical Reasoning for Everyday Life (5th Edition)


 Glencoe Algebra 1, Student Edition, 9780079039897...AlgebraISBN:9780079039897Author:CarterPublisher:McGraw Hill
 Big Ideas Math A Bridge To Success Algebra 1: Stu...AlgebraISBN:9781680331141Author:HOUGHTON MIFFLIN HARCOURTPublisher:Houghton Mifflin Harcourt