
Concept explainers
Videos
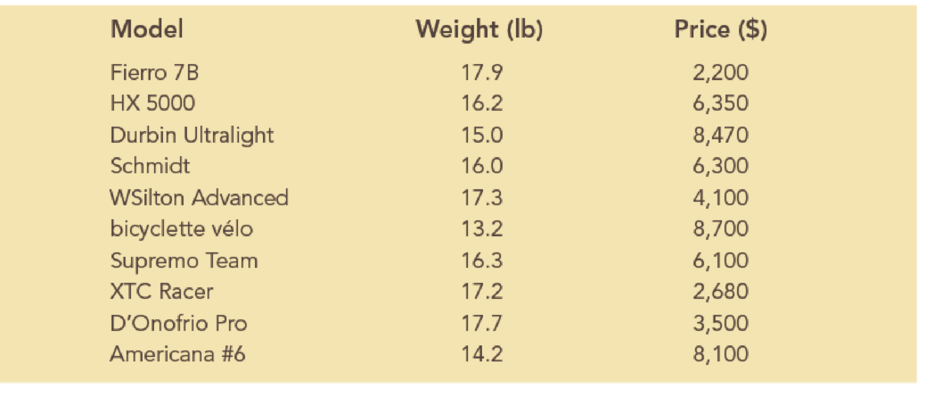
Bicycling World, a magazine devoted to cycling, reviews hundreds of bicycles throughout the year. Its Road-Race category contains reviews of bicycles used by riders primarily interested in racing. One of the most important factors in selecting a bicycle for racing is its weight. The following data show the weight (pounds) and price ($) for ten racing bicycles reviewed by the magazine:
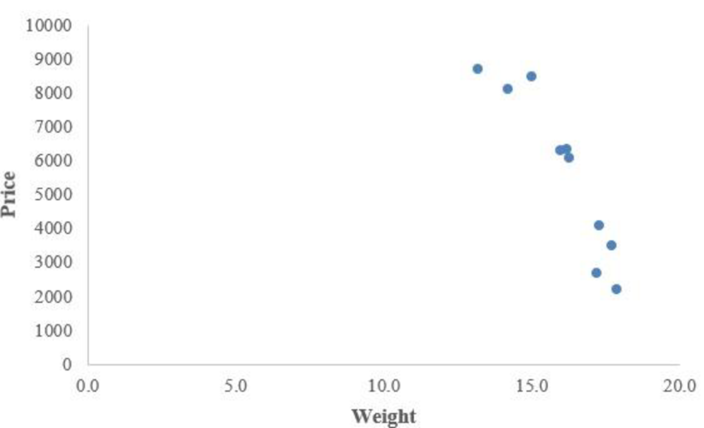
- a. Develop a scatter chart with weight as the independent variable. What does the scatter chart indicate about the relationship between the weight and price of these bicycles?
- b. Use the data to develop an estimated regression equation that could be used to estimate the price for a bicycle, given its weight. What is the estimated regression model?
- c. Test whether each of the regression parameters β0 and β1 is equal to zero at a 0.05 level of significance. What are the correct interpretations of the estimated regression parameters? Are these interpretations reasonable?
- d. How much of the variation in the prices of the bicycles in the sample does the regression model you estimated in part (b) explain?
- e. The manufacturers of the D’Onofrio Pro plan to introduce the 15-lb D’Onofrio Elite bicycle later this year. Use the regression model you estimated in part (a) to predict the price of the D’Ononfrio Elite.
a.
Draw a scatter chart with the weight as the independent variable.
Explain about the scatter chart.
Answer to Problem 1P
The scatter chart is represented below:
Explanation of Solution
The data related to the weights (in lb) and price (in $) of 10 different bicycles.
Software procedure:
Step-by-step software procedure to obtain scatter chart using EXCEL is defined as follows:
- Open an EXCEL file.
- In column B enter the data of Weight and in column C enter the corresponding values of Price.
- Select the data that is to be displayed.
- Click on the Insert Tab > select Scatter icon.
- Choose a Scatter with only Markers.
- Click on the chart > select Layout from the Chart Tools.
- Select Axis Title > Primary Horizontal Axis Title > Title Below Axis.
- Enter Weight in the dialog box
- Select Axis Title > Primary Vertical Axis Title > Rotated Title.
- Enter Price in the dialog box.
Interpretation:
The scatter diagram indicates there is a negative relationship between the variable price and weight. Hence, it can be said that as the weight of the bicycle increases the price decreases. Moreover, the change is moderately linear.
b.
Find an estimated regression equation that could be used to estimate the price for a bicycle, given its weight.
Answer to Problem 1P
The estimated regression equation that could be used to estimate the price for a bicycle, given its weight, is
Explanation of Solution
Calculation:
In this given problem, weight is the independent variable and price is dependent variable.
Step-by-step procedure to obtain the estimated regression equation using EXCEL is defined as follows:
- In EXCEL sheet, enter Weight and Price in columns B and C, respectively.
- In Data, select Data Analysis and choose Regression.
- In Input Y Range, select $C$1:$C$11.
- In Input X Range, select $B$1:$B$11.
- Select Labels.
- Click OK.
Output obtained using EXCEL is given below:
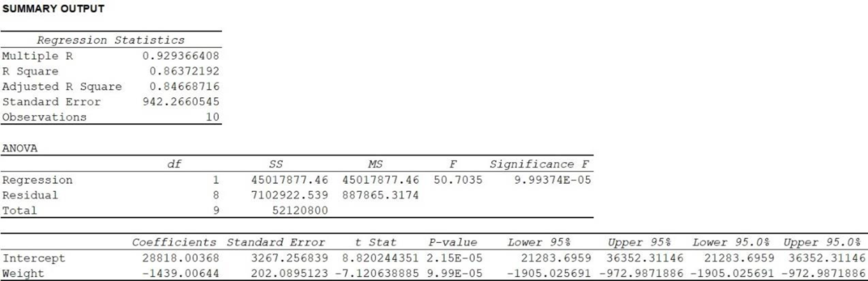
Thus, the estimated regression equation that could be used to estimate the price for a bicycle, given its weight, is
c.
Test whether each of the regression parameters
Explain whether the interpretations are reasonable and provide the correct interpretations.
Answer to Problem 1P
The data provide sufficient evidence to conclude that the intercept has significant use in the model at 0.05 level of significance.
The data provide sufficient evidence to conclude that there is a significant relationship between Weight and price at 0.05 level of significance.
Explanation of Solution
Calculation:
Consider that
State the test hypotheses.
Null hypothesis:
That is, the intercept has no significant use in the model.
Alternative hypothesis:
That is, the intercept has significant use in the model.
From the output in Part (b), it is found that the t-test statistic corresponding to intercept is 8.820 and the corresponding p-value is approximately 0.
Level of significance:
The given level of significance is
Rejection rule:
- If the
- Otherwise failed to reject the null hypothesis.
Conclusion:
Here, the p value is less than the level of significance.
That is,
Thus, the decision is “reject the null hypothesis”.
Therefore, the data provide sufficient evidence to conclude that the intercept has significant use in the model at 0.05 level of significance.
From the output in Part (b), it is obtained that the estimated value of the intercept is 28,818.0037, which implies that the price of a bicycle with 0 lb weight is $28.818.0037.
Thus, the result is practically not possible and not reasonable.
Consider that
Null hypothesis:
That is, there is no significant relationship between Weight and price.
Alternative hypothesis:
That is, there is a significant relationship between Weight and price.
From the output in Part (b), it is found that the t-test statistic corresponding to weight is –7.120 with p-value of approximately 0.
Conclusion:
Here, the p value is less than the level of significance.
That is,
Thus, the decision is “reject the null hypothesis”.
Therefore, the data provide sufficient evidence to conclude that there is a significant relationship between Weight and price at 0.05 level of significance.
Thus, the price and Weight bicycles are related.
Thus, the slope of –1,439.0064 indicates that the predicted price of a bicycle decreases about $1,439.0064 for every additional 1 lb Weight in the bicycle.
The slope implies same result as scatterplot. Hence, the result is reasonable.
d.
Find the amount of variation in the prices explained by the regression model.
Answer to Problem 1P
The amount of variation in the prices explained by the regression model is 86.37%.
Explanation of Solution
From Part (b) output,
Thus, 86.37% variability in price is explained by weight using the linear regression model.
Thus, the estimated regression equation provides a good fit.
e.
Predict the price of the elite bicycle with 15 lb weight.
Answer to Problem 1P
The predicted price of the elite bicycle with 15 lb weight is $7,232.91.
Explanation of Solution
Calculation:
From Part (b), it is found that the estimated regression equation that could be used to estimate the price for a bicycle, given its weight, is
Thus, the predicted price of the elite bicycle with 15 lb weight is calculated as follows:
Thus, the predicted price of the elite bicycle with 15 lb weight is $7,232.91.
Want to see more full solutions like this?
Chapter 4 Solutions
Essentials Of Business Analytics


 Glencoe Algebra 1, Student Edition, 9780079039897...AlgebraISBN:9780079039897Author:CarterPublisher:McGraw Hill
 Holt Mcdougal Larson Pre-algebra: Student Edition...AlgebraISBN:9780547587776Author:HOLT MCDOUGALPublisher:HOLT MCDOUGAL
 Big Ideas Math A Bridge To Success Algebra 1: Stu...AlgebraISBN:9781680331141Author:HOUGHTON MIFFLIN HARCOURTPublisher:Houghton Mifflin Harcourt
 Functions and Change: A Modeling Approach to Coll...AlgebraISBN:9781337111348Author:Bruce Crauder, Benny Evans, Alan NoellPublisher:Cengage Learning