
Concept explainers
Videos
For Exercises 1-14,
a. Write the domain.
b. Write the range.
c. Find the x-intercept(s).
d. Find the y-intercept.
e. Determine the asymptotes if applicable.
f. Determine the intervals over which the function is increasing.
g. Determine the intervals over which the function is decreasing.
h. Match the function with its graph.
1.
(a)
To find the domainof the function
Answer to Problem 1PRE
The domain of function
Explanation of Solution
Given: The function
Formula Used:
The domain of a function is the set of input or argument values for which the function is real and defined.
Calculation:
The function has no undefined points nor domain constraints. So, the domain will be all real numbers.
Therefore, the domain is
Conclusion:
The domain of function
(b)
To find the range of the function
Answer to Problem 1PRE
The range of function
Explanation of Solution
Given: The function
Formula Used:
The range of a function is the set of values of the dependent variable for which a function is defined.
Calculation:
Here, the function
Conclusion:
The range of function
(c)
To find x-intercept of the function
Answer to Problem 1PRE
There is no x-intercept
Explanation of Solution
Given: Function -
Formula Used:
x-intercept is a point on the graph where
Calculation:
The y-intercept of a function is obtained at the point when
But,
So, there is no such value of x which gives
Conclusion:
Hence, there are no x-axis interception points.
(d)
To find the y-intercept of the function
Answer to Problem 1PRE
The y-intercept of function
Explanation of Solution
Given: Function -
Formula Used:
y-intercept is a point on the graph where
Calculation:
Function is given as
For y-intercept,
And
Thus, y-axis interception point is
Conclusion:
The y-intercept of function
(e)
To find Asymptotes (if applicable) of the function
Answer to Problem 1PRE
There are no asymptotes of the function
Explanation of Solution
Given: Function -
Formula Used:
If
Calculation:
Given function is
There are no asymptotes as polynomial functions of degree 1 or higher can’t have asymptotes.
Conclusion:
Hence, there is no asymptote for the function
(f)
To find intervals over which the function
Answer to Problem 1PRE
Function is not an increasing function.
Explanation of Solution
Given: Function -
Formula Used:
If
Calculation:
Derivative of
Thus, the function is not increasing.
Conclusion:
Hence, function is not an increasing function
(g)
To find intervals over which the function
Answer to Problem 1PRE
Function is not a decreasing function.
Explanation of Solution
Given: Function -
Formula Used:
If
Calculation:
Derivative of
Thus, the function is not decreasing.
Conclusion:
Hence, the function is not a decreasing function
(h)
To graph the function
Explanation of Solution
Given: Function -
Graph:
Given function is
When
When
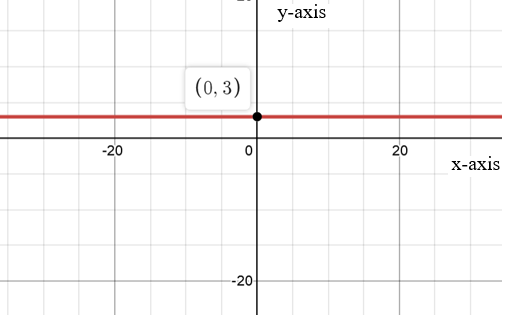
Thus, the graph is matched with the function
Want to see more full solutions like this?
Chapter 4 Solutions
COLL.ALGEBRA & TRIG ACCESS


- Suppose you have a job that pays $8.50 per hour and you work anywhere from 10 to 40 hours per week. a. Write an equation, with a restriction on the variable x, that gives the amount of money, y, you will earn for working x hours in one week. b. Use the function rule you have written in part (a) to complete Table 4. c. Construct a line graph from the information in Table 4. d. State the domain and range of this function.arrow_forwardA company determines that its weekly profit from manufacturing and selling x units of a certain item is given by Px=-x3+3x2+2880x-500. Use a graphing utility to find the weekly production rate that will maximize the profit.arrow_forwardSuppose the range of a function fis [5,8] . What is the range of |f(x)| ?arrow_forward
- Why does the horizontal line test tell us whether the graph of a function is one-to-one?arrow_forwardA business has a cost function of C=0.4x+8000, where C is measured in dollars and x is the number of units produced. The average cost per unit is given by C=Cx=0.4x+8000x,x0. a. Find the average costs per unit when x=1000,x=8000,x=20,000,andx=100,000. b. What is the horizontal asymptote of the graph of this function, and what does it represent?arrow_forwardThe total revenue (TR in $) for a textbook on mathematical economics is given by the equation TR = 1800Q − Q2 − 44375, where Q is the number of books sold. a.Draw the graph of the TR function using the example as in WolframAlpha. Can you guess the number of books to be sold to maximise the revenue? (Please take a snip of your graph and add it to your document) b. Find the number of books sold when the TR is $765,625? You can apply the quadratic formula or the method of completing squares.arrow_forward
- 1. Find a formula for the function whose graph consists of the line segment from the point (−4,3) to the point (−2,0) and the lower half of the circle centered at the origin with radius 2. 2. If the domain of the function ?=?(?) equals (−1,5]∪[8,10], what is the domain of the new function ?=5?(?+3)−20? Explainarrow_forwardSuppose that a company has just purchased a new computer for $2400. The company chooses to depreciate using the straight-line method for 4 years? (a) Write a linear function that expresses the book value V of the computer as a function of its age x. (b) What is the domain of the function found in part (a)? (c) Graph the linear function. (d) What is the book value of the computer after 2 years? (e) When will the computer have a book value of $600?arrow_forwardWhen given the equation for a function, how can you determinewhere it is increasing and where it is decreasing?arrow_forward
- A T-shirt manufacturer is planning to expand its workforce. It estimates that the number of T-shirts produced by hiring x new workers is given by T(x)=−0.75x4+9x3, 0≤x≤9. When is the rate of change of T-shirt production increasing and when is it decreasing?( Type your answer in interval notation.) What is the point of diminishing returns and the maximum rate of change for T-shirt production? Graph T and T′ on the same coordinate system.arrow_forwardStudent Loans Data for selected years from 2011and projected to 2023 can be used to show that thebalance of federal direct student loans y, in billions ofdollars, is related to the number of years after 2010,x, by the function y = 130.7x + 699.7.a. Graph the function for x-values corresponding2010 to 2025.b. Find the value of y when x is 13.c. What does this function predict the balance offederal direct student loans will be in 2029?(Source: U.S. Office of Management and Budget)arrow_forwardTrue or False The graph of a function y = f1x2 alwayscrosses the y-axis.arrow_forward

 Glencoe Algebra 1, Student Edition, 9780079039897...AlgebraISBN:9780079039897Author:CarterPublisher:McGraw Hill
 Algebra for College StudentsAlgebraISBN:9781285195780Author:Jerome E. Kaufmann, Karen L. SchwittersPublisher:Cengage Learning
 Trigonometry (MindTap Course List)TrigonometryISBN:9781305652224Author:Charles P. McKeague, Mark D. TurnerPublisher:Cengage Learning
 Holt Mcdougal Larson Pre-algebra: Student Edition...AlgebraISBN:9780547587776Author:HOLT MCDOUGALPublisher:HOLT MCDOUGAL