
Videos
The figure below shows the market for vacation rental homes before and after the imposition of a 12 percent tax. How can we use the figure to measure the effect the tax has on economic efficiency? Redraw the graph and show the area representing the excess burden created by the implementation of the tax.
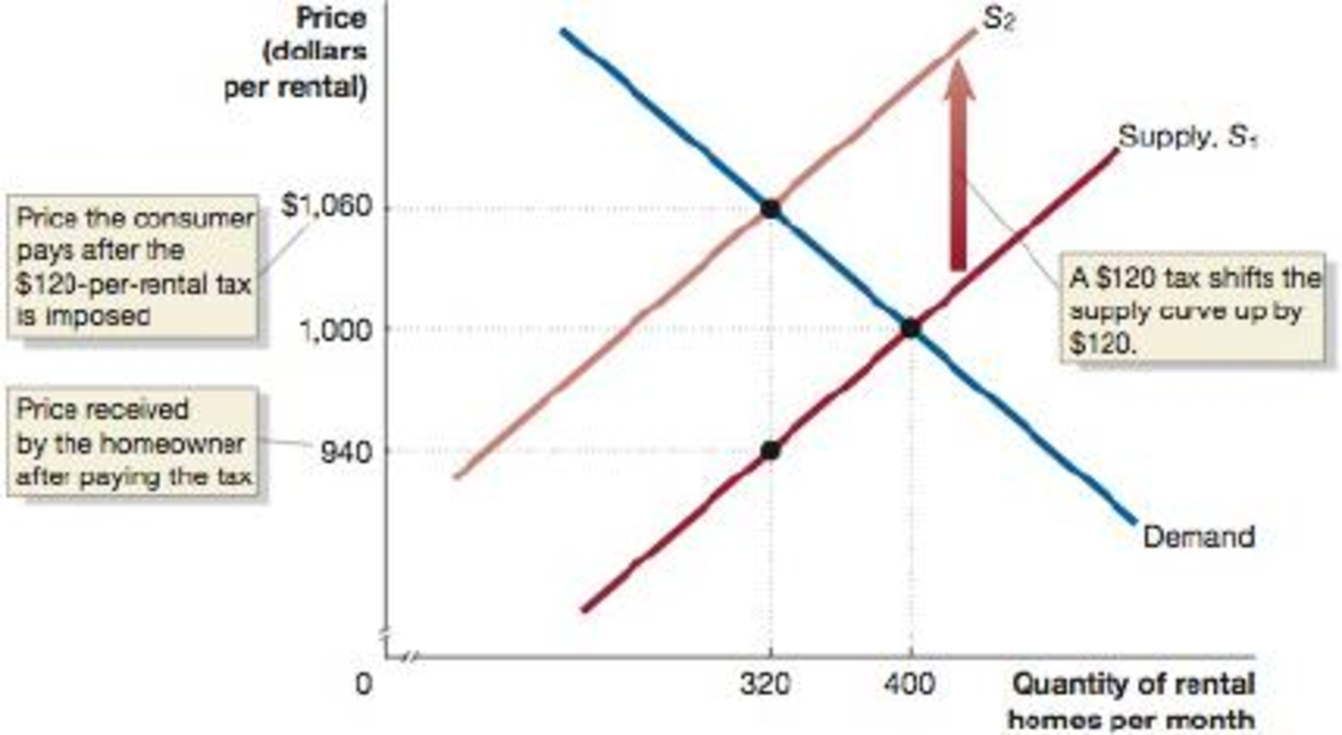
The market for vacation rental homes before and after the imposition of a 12 percent hotel tax shows that the tax shifts the supply curve up by $120, increasing the price paid by the consumer from $1,000 to $1,060 and decreasing the price received by the homeowner from $1,000 to $940.
The effect of tax on economic efficiency.
Explanation of Solution
The tax is a unilateral payment made to the government from the public for various purposes. There are many types of taxes, such as the income tax, wealth tax and so forth which constitutes the major portion of the revenue of the government that can be used for making the public expenditures. Economic efficiency is a situation where no one can be in a better position without hurting the other. In the case, the economic efficiency is the situation where the marginal benefit of the consumer from the last unit produced is equal to the marginal cost of the production of the unit. This means that both of them will be the same and neither the consumer nor the producer can be in a better position. The sum of the consumer surplus and the producer surplus, which is the economic surplus will be at its maximum.
Here, the tax imposed on the vacation rental homes is 12% which is equal to $120. This is because the equilibrium rent was $1000 before the tax and the equilibrium quantity of rental rooms demanded and supplied was 400. After the introduction of the tax on the rental homes, the price of the rental homes increased to $1,060 which is $60 higher than the equilibrium rent. As a result of the new tax, the supply curve shifts upwards by the amount of tax imposed.
Thus, the supply vertically shifts by the tax amount of $120 and as a result, the quantity demanded decreases to 320 rental houses. The owner of the house receives only $940 which is the reason for the decrease in the supply of the rental houses in the market. Thus, the consumer has to pay $60 more than the equilibrium price, whereas the owner receives $60 less than the equilibrium price received by him before the tax. Thus, the tax is equally shared among the consumer and the owner by $60 each. The economic efficiency is reduced by the tax because there will be deadweight loss in the economy due to the tax imposed by the government. The deadweight loss in the economy can be represented by the grey shaded area in the graph as follows:
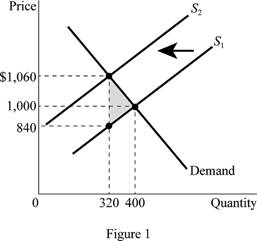
The new quantity demanded after the introduction of the tax is 320 houses and the new price after the introduction of the tax is $1,060. The price actually received by the owner of the house also reduces to $940 which means that both the owner and the consumer is paying $60 each as tax. This shows that the tax burden is evenly distributed among the seller and the buyer. There is deadweight loss in the economy because of the tax and it can be denoted by the area shaded in grey color on the graph.
Concept introduction:
Tax: It is the unilateral payment made by the public towards the government. There are many different types of taxes in the economy which includes the income tax, property tax and professional tax and so forth.
Economic efficiency: It is the situation where the economy is efficient. Which means that the marginal benefit from the last unit produced is equal to the marginal cost of production and the economic surplus will be at is maximum.
Want to see more full solutions like this?
Chapter 4 Solutions
Macroeconomics Plus MyEconLab with Pearson eText (1-semester access)
Additional Business Textbook Solutions
Econ Micro (book Only)
ECON: MICRO4 (New, Engaging Titles from 4LTR Press)
Foundations of Economics (8th Edition)
Principles of Economics 2e
Engineering Economy (16th Edition) - Standalone book


- Consider the market for mountain bikes .The following graph shows the demand and supply for mountain bikes before the government imposes any taxes Complete the following table by using the previous graphs to determine the values of consumer and producer surplus before the tax , and consumer surplus , producer surplus , tax revenue and dead weight loss after tax . Note : you can determine the areas of different portions of the graphs by selecting the relevant area Consumer surplus before tax and after tax : Producer surplus before and after tax : Tax revenue after tax : Deadweight loss after tax :arrow_forwardSuppose the demand and the supply for lumber (harvested wood processed in a sawmill) used for construction in Australia are given byQD =100 – 2PQS = 1/2PAssume also that the market is perfectly competitive. 7. Steel is a substitute for lumber in construction. Now suppose the price for steel rises. Use a graph of supply and demand to show what happens in equilibrium. Show changes relative to the original equilibrium you found. 8. back to the orginial graph once more, the government introduces a subsidy of s=5 per unit of lumber transacted in the market. Calculate the new equilibrium quantity and the price paid by consumers and received by producers.9. Given the subsidy in 8, calculate and illustrate in a graph the consumer surplus, producer surplus and subsidy expenditure.10. Calculate the deadweight loss caused by the subsidy in 8 and illustrate it in a graph. 11. Who benefits more from the subsidy, consumers or producers? Why?arrow_forwardUsing the following diagram (the equilibrium quantity is 5.5, the supply curve intersects the price axis at 3.5), answer these questions: a) If a tax of $2 were imposed, what price would buyers pay, and what price would suppliers receive? How much revenue would be raised by the tax? Compute the total consumer surplus, producer surplus, and welfare after the introduction of the tax. b) If a subsidy of $5 were imposed, what price would buyers pay, and what price would suppliers receive? How much would the subsidy cost the government? What would be the consumer surplus and the producer surplus? c) If the government imposed a binding price floor of $7 and compensated the producers by buying the excess surplus at the stated price: What would be the consumer surplus, the producer surplus, the government expenditures, and total welfare?arrow_forward
- Suppose the price elasticity of demand for smartphones is 0.5 (absolute value), while the price elasticity of supply is 1.9. If the government imposes a per-unit tax of $100 on the sellers of smartphones, how will the price and quantity transacted of smartphones change? Will the sellers or the buyers bear a larger tax burden? Will the market be able to achieve economic efficiency after the tax is imposed? Explain with a diagram.arrow_forwardLet D(x)=(x-5)^2 be the price that consumers are willing to pay for x items and S(x)=x^2 +2x+1 be the price, in dollars, that producers are willing to accept for x units of the item. Assume x (less than equal to) 5. a. find the equilibrium point b. find the consumer surplus at the equilibrium point. sketch a graph to show what this value is represented by on the supple/demand curved c. Find the producer surplus at the equilibrium point. Label on the graph above where the producer surplus is depicted.arrow_forwardConsider the attached graph showing the supply and demand for rental apartments around the UH. campus. If the government were to subsidize housing by $1000 per unit per month, then the quantity of rental apartments would____ (increase or decrease) by____ thousand units. The rental price received by landlords inclusive of the subsidy would ____(increase or decrease) by_____ dollars per month while the price paid by tenants, net of the subsidy, would____ (increase or decrease) by____ dollars per montharrow_forward
- Suppose the demand curve for notebook is Q = 10,000 – 500P, where Q is number of notebooks per month and P is dollars/notebook. a. Find and graph the inverse demand. Find consumer surplus if the price is $10/notebook. b. Find the point elasticity of demand at P = $10. Hint: use the direct demand curve. What does the number you have calculated tell you?arrow_forwardExternalities - Definition and examples An externality arises when a firm or person engages in an activity that affects the wellbeing of a third party, yet neither pays nor receives any compensation for that effect. If the impact on the third party is adverse, it is called a ___________ externality. The following graph shows the demand and supply curves for a good with this type of externality. The dashed drop lines on the graph reflect the market equilibrium price and quantity for this good.arrow_forwardGraph the following In the market for smartphones, the price elasticity of supply is +0.8, and the price elasticity of demand is -1.2. At equilibrium, price is $800 and quantity is 400000. (1a) Assuming supply and demand are linear, reconstruct and draw the supply and demand curves. Label the intercepts. (1b) To help consumers and phone-makers, the government proposes to subsidize smartphones by $80 each. What are PB and PS after the subsidy? What is the new equilibrium quantity? Illustrate them on the same graph. (c) Calculate the change in consumer surplus, producer surplus, government expenditure, and deadweight loss and identify them on the graph.arrow_forward
- Use the following graph to answer the question: how much is producer surplus? What is the total value to consumers of consuming the first ten units of this good? Use the following graph to answer the question: how much is producer surplus? What is the total value to consumers of consuming the first ten units of this good?arrow_forwardThe market demand and supply equations for theme park in a city are given by P = 30 – 0.005QD and P = 10 + 0.005QS, where P is the price in dollars and QD is the quantity of theme-park tickets demanded and QS is the quantity of theme park ticket supplied. (i) Solve for the equilibrium price and quantity of theme park tickets and compute the consumer surplus and producer surplus. Support your answers with a graph of the theme park tickets market.(ii) Explain the implications of the welfare of consumers, producers and the society when the price of theme park ticket is fixed at $15. Support your answers with a graph of the theme park tickets market.arrow_forwardThe market demand and supply equations for theme park in a city are given by P = 30 – 0.005QD and P = 10 + 0.005QS, where P is the price in dollars and QD is the quantity of theme-park tickets demanded and QS is the quantity of theme park ticket supplied. (i) Solve for the equilibrium price and quantity of theme park tickets and compute the consumer surplus and producer surplus. Support your answers with a graph of the theme park tickets market.(ii) Explain the implications of the welfare of consumers, producers and the society when the price of theme park ticket is fixed at $15. Support your answers with a graph of the theme park tickets market.(b) The availability of alternative entertainment methods has resulted in a large decrease in theme-park visitors. To help the theme-park operators, the government is contemplating imposing a price floor for theme-park tickets or provide a subsidy to theme park visitors. Appraise the welfare effects of these two policies with suitable…arrow_forward
 Microeconomics: Principles & PolicyEconomicsISBN:9781337794992Author:William J. Baumol, Alan S. Blinder, John L. SolowPublisher:Cengage Learning