
Concept explainers
Videos
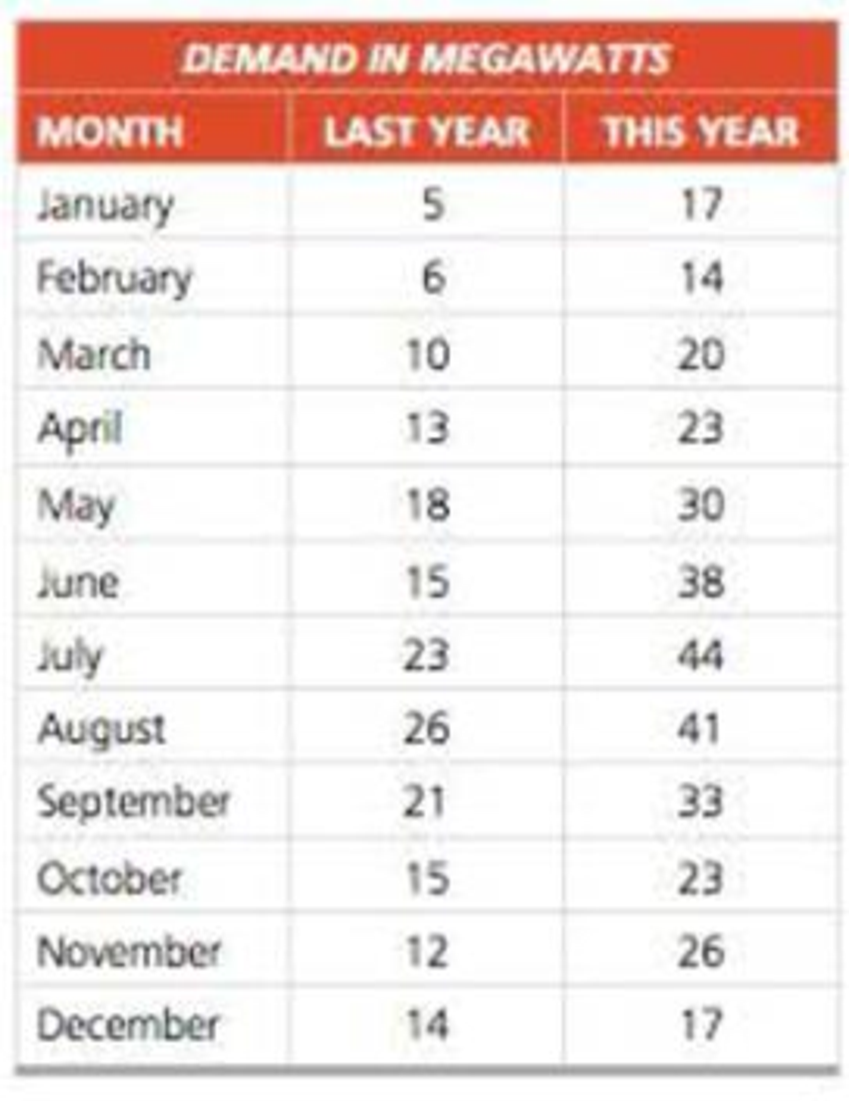
CEO John Goodale, at Southern Illinois Power and Light, has been collecting data on demand for electric power in its western subregion for only the past 2 years. Those data are shown in the table below.
To plan for expansion and to arrange to borrow power from neighboring utilities during peak periods, Goodale needs to be able to forecast demand for each month next year. However, the standard
a) What are the weaknesses of the standard forecasting techniques as applied to this set of data?
b) Because known models are not appropriate here, propose your own approach to forecasting. Although there is no perfect solution to tackling data such as these (in other words, there are no 100% right or wrong answers), justify your model.
c) Forecast demand for each month next year using the model you propose.
Want to see the full answer?
Check out a sample textbook solution
Chapter 4 Solutions
Principles of Operations Management: Sustainability and Supply Chain Management (10th Edition)


- Under what conditions might a firm use multiple forecasting methods?arrow_forwardThe file P13_42.xlsx contains monthly data on consumer revolving credit (in millions of dollars) through credit unions. a. Use these data to forecast consumer revolving credit through credit unions for the next 12 months. Do it in two ways. First, fit an exponential trend to the series. Second, use Holts method with optimized smoothing constants. b. Which of these two methods appears to provide the best forecasts? Answer by comparing their MAPE values.arrow_forwardThe Baker Company wants to develop a budget to predict how overhead costs vary with activity levels. Management is trying to decide whether direct labor hours (DLH) or units produced is the better measure of activity for the firm. Monthly data for the preceding 24 months appear in the file P13_40.xlsx. Use regression analysis to determine which measure, DLH or Units (or both), should be used for the budget. How would the regression equation be used to obtain the budget for the firms overhead costs?arrow_forward
- The file P13_29.xlsx contains monthly time series data for total U.S. retail sales of building materials (which includes retail sales of building materials, hardware and garden supply stores, and mobile home dealers). a. Is seasonality present in these data? If so, characterize the seasonality pattern. b. Use Winters method to forecast this series with smoothing constants = = 0.1 and = 0.3. Does the forecast series seem to track the seasonal pattern well? What are your forecasts for the next 12 months?arrow_forwardThe owner of a restaurant in Bloomington, Indiana, has recorded sales data for the past 19 years. He has also recorded data on potentially relevant variables. The data are listed in the file P13_17.xlsx. a. Estimate a simple regression equation involving annual sales (the dependent variable) and the size of the population residing within 10 miles of the restaurant (the explanatory variable). Interpret R-square for this regression. b. Add another explanatory variableannual advertising expendituresto the regression equation in part a. Estimate and interpret this expanded equation. How does the R-square value for this multiple regression equation compare to that of the simple regression equation estimated in part a? Explain any difference between the two R-square values. How can you use the adjusted R-squares for a comparison of the two equations? c. Add one more explanatory variable to the multiple regression equation estimated in part b. In particular, estimate and interpret the coefficients of a multiple regression equation that includes the previous years advertising expenditure. How does the inclusion of this third explanatory variable affect the R-square, compared to the corresponding values for the equation of part b? Explain any changes in this value. What does the adjusted R-square for the new equation tell you?arrow_forwardThe file P13_28.xlsx contains monthly retail sales of U.S. liquor stores. a. Is seasonality present in these data? If so, characterize the seasonality pattern. b. Use Winters method to forecast this series with smoothing constants = = 0.1 and = 0.3. Does the forecast series seem to track the seasonal pattern well? What are your forecasts for the next 12 months?arrow_forward
- The file P13_22.xlsx contains total monthly U.S. retail sales data. While holding out the final six months of observations for validation purposes, use the method of moving averages with a carefully chosen span to forecast U.S. retail sales in the next year. Comment on the performance of your model. What makes this time series more challenging to forecast?arrow_forwardThe file P13_26.xlsx contains the monthly number of airline tickets sold by the CareFree Travel Agency. a. Create a time series chart of the data. Based on what you see, which of the exponential smoothing models do you think will provide the best forecasting model? Why? b. Use simple exponential smoothing to forecast these data, using a smoothing constant of 0.1. c. Repeat part b, but search for the smoothing constant that makes RMSE as small as possible. Does it make much of an improvement over the model in part b?arrow_forwardAlvin Cheah is a marketing analyst for Rockstar Travel Company. He wants to analyze the trend of international tourist arrival in Tawau by using international tourist arrival rate and flight delayed rate over the past 10 years as given in Table 2 below: (Hint: Provides your answers in two decimal points) (i) Propose ONE (1) forecasting model that can be used by Alvin. Why would you proposed that particular model? (ii) Develop the forecasting model that you suggest in (i). Briefly explain your model.arrow_forward
- Sales of Volkswagen's popular Beetle have grown steadily at auto dealerships in Nevada during the past 5 years (see table below). Using exponential smoothing with a smoothing constant (α) of 0.30 and a starting forecast of 415.00, the following sales forecast has been developed: Year Sales Forecasted Sales 2005 455 415.00 2006 502 427.00 2007 518 449.50 2008 563 470.05 2009 584 497.94 Part 2 The MAD for a forecast developed using exponential smoothing with α = 0.30 is enter your response here sales (round your response to two decimal places). Part 3 Forecasted sales for years 2006 through 2010 using exponential smoothing with α = 0.60 and a starting forecast of 415.00 are (round your responses to two decimal places): Year 2005 2006 2007 2008 2009 2010 Forecasted Sales 415.00 enter your response here enter…arrow_forwardThe Hartley-Davis motorcycle dealer in the Minneapolis– St. Paul area wants to be able to forecast accurately the de-mand for the Roadhog Super motorcycle during the next month. From sales records, the dealer has accumulated thedata in the following table for the past year. a. Compute a three-month moving average forecast ofdemand for April through January (of the next year).b. Compute a five-month moving average forecast forJune through January.c. Compare the two forecasts computed in parts (a) and(b) using MAD. Which one should the dealer use forJanuary of the next year? Month Motorcycle SalesJanuary 9February 7March 10April 8May 7June 12July 10August 11September 12October 10November 14December 16arrow_forwardTwo different forecasting techniques (F1 and F2) were used to forecast demand for cases of bottled water. Actual demand and the two sets of forecasts are as follows: PREDICTED DEMAND Period Demand F1 F2 1 68 66 66 2 75 68 68 3 70 72 70 4 74 71 72 5 69 72 74 6 72 70 76 7 80 71 78 8 78 74 80 Click here for the Excel Data File Compute MAD for each set of forecasts. Given your results, which forecast appears to be more accurate? (Round your answers to 1 decimal place.) b. Compute the MSE for each set of forecasts. Given your results, which forecast appears to be more accurate? (Round your answers to 2 decimal places.) c. In practice, either MAD or MSE would be employed to compute forecast errors. What factors might lead a manager to choose one rather than the other? d. Compute MAPE for each data set. Which forecast appears to be more accurate? (Round your intermediate calculations and final answers to 2 decimal places.)arrow_forward
 Practical Management ScienceOperations ManagementISBN:9781337406659Author:WINSTON, Wayne L.Publisher:Cengage,
 Contemporary MarketingMarketingISBN:9780357033777Author:Louis E. Boone, David L. KurtzPublisher:Cengage Learning
 MarketingMarketingISBN:9780357033791Author:Pride, William MPublisher:South Western Educational Publishing