
Videos
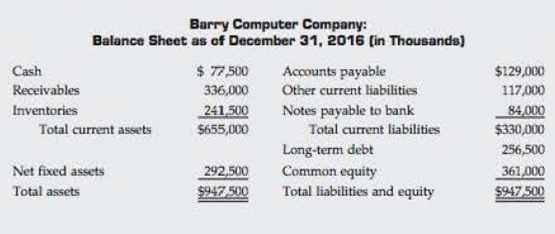
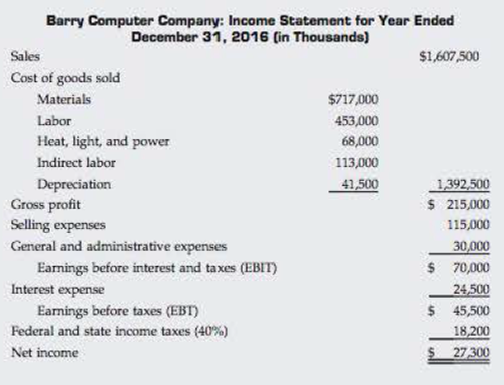
RATIO ANALYSIS Data for Barry Computer Co. and its industry averages follow.
- a. Calculate the indicated ratios for Barry.
- b. Construct the DuPont equation for both Barry and the industry.
- c. Outline Barry’s strengths and weaknesses as revealed by your analysis.
- d. Suppose Barry had doubled its sales as well as its inventories, accounts receivable, and common equity during 2016. How would that information affect the validity of your ratio analysis? (Hint: Think about averages and the effects of rapid growth on ratios if averages are not used. No calculations are needed.)
| Ratio | Barry | Industry Average |
| Current | ----- | 2.0× |
| Quick | ----- | 13× |
| Days sales outstandinga | ----- | 35 days |
| Inventory turnover | ----- | 6.7× |
| Total assets turnover | ----- | 3.0× |
| Profit margin | ----- | 1.2% |
| ------ | 3.6% | |
| ----- | 9.0% | |
| ----- | 73% | |
| TIE | ----- | 3.0× |
| Debt/Total capital | ----- | 47.0% |
aCalculation is based on a 365-day year.
(a)
To determine: The indicated ratios.
Ratio Analysis
Ratio is used to compare two arithmetical figures. In case of the ratio analysis of the company the financial ratios are calculated. The financial ratios examine the performance of the company and is used in comparing with other same business. It indicates the relationship of two or more parts of financial statements.
Current Ratio
Current ratio is a part of liquidity ratio which reflects the capability of the company to payback its short term debts. It is calculated based on the current assets and current liabilities that a company possesses in an accounting period.
Explanation of Solution
Given,
Current asset is$655,000.
Current liabilities is $330,000.
The formula to calculate present current ratio is,
Substitute $655,000 for current asset and $330,000 for current liabilities.
Thus, current ratio is 1.98 times.
Quick Ratio
It is also known as the acid-test ratio which is used to determine the company’s capability to satisfy the dues using only liquid assets. The excluding of less liquid assets inventory shows the liquidity of a company in a better manner.
Given,
Current asset is $655,000.
Inventory is $241,500.
The formula of quick ratio is,
Substitute $655,000 for current assets, $330,000 for current liabilities and $241,500 for inventory.
Thus, quick ratio is 1.25 times.
Days sales Outstanding
Days sales outstanding is used to measure days that a business usually requires to collects its receivable in average. It indicates account receivable of the firm and the firm’s efficiency in collecting the account receivable.
Given,
Receivables are $336,000.
Annual sale is $1,607,500.
The formula to calculate Days sales outstanding is,
Substitute $336,000 for account receivables and $1,607,500 for annual sales.
Thus, Days sales outstanding is 76.29 days.
Inventory Turnover Ratio
Inventory turnover reflects the number of times an average inventory is converted into sales during a period. It is used to measure the efficiency of business operations.
Given,
Total sale is $1,607,500.
Total inventory $241,500.
The formula of inventory turnover ratio is,
Substitute $1,607,500 for total sales and $241,500 for total inventory.
Thus, inventory turnover ratio is 6.66 times.
Total Assets Turnover Ratio
It indicates how effectively the asset of the company is utilized. Total asset is the sum of current assets and fixed assets.
Given,
Total sales are $1,607,500.
Total assets are $947,500.
The formula of total assets turnover is,
Substitute $1,607,500 for total sales and $947,500 for total assets.
Thus, total assets turnover is 1.70 times.
Return on Assets
It is a profitability ratio. This ratio shows profit earning capability on per dollar of assets. It shows the percentage of net income on total assets. Higher the returns on assets better the profitability. Total assets include fixed as well as current assets.
Given,
Net income is$27,300.
Total assets are $947,500.
The formula of return on asset is,
Substitute $27,300 for net income and $947,500 for total value of assets.
Thus, return on assets is 2.88%.
Return on Equity
Return on equity is the return from the equity. It is the ratio of net income and shareholders’ equity. This ratio measures the performance of the company and tells how well the company is performing. This ratio is used to compare a firm with their competitors.
Given,
Net income is $27,300.
Common equity is $361,000.
The formula of return on equity is,
Substitute $27,300 for net income and $361,000 for common equity in above formula.
Thus, return on equity is 7.56%.
Return on Invested Capital (ROIC)
It represent the amount of return earned by all investors and can be calculated by dividing total earnings available for investors to total invested capital.
Given,
Earnings before interest and tax (EBIT) are $70,000.
Tax rate is 40%.
Total debt is $340,500 (working note).
Total equity is $361,000.
The formula of ROIC is,
Substitute $70,000 for EBIT, $340,500 for debt, 40% for tax and $361,000 for equity in above formula.
Thus, Return on invested capital is 5.99%.
Working note:
Compute total debt.
Long term debt is $256,500.
Notes payable to bank is $84,000.
The total debt of the company is:
Times-Interest Earned Ratio
It is the type of solvency ratio which indicates the capability of business to repay interest and provide debt related services. It shows the relation between EBIT and long-term debt. It determines the debt servicing capacity of a business keeping in view of the fixed interest on long-term debt.
Given,
EBIT is $70,000.
Interest expense is $24,500.
The formula to calculate times interest earned is,
Substitute $70,000 for EBIT and $24,500 for interest expense.
Thus, the Times Interest Earned ratio is 2.86%.
Debt/Total Capital
It is percentage of total capital which is financed by borrowed fund. Borrowed fund includes short and long term debts. Operating debt like account payable, accrual are not considered.
Given,
Total debt is $340,500 (working note).
Equity is $361,000
The formula of Debt/Total capital is,
Substitute $340,500 for total debt and $361,000 for equity.
Thus, debt/total capital ratio is 48.54%.
Working notes:
Compute total debt.
Given,
Long term debt is $256,500.
Notes payable to bank is $84,000.
Calculation of total debt,
Thus, total debt is $340,500.
(b)
To construct: The Du Pont equation for both Company B and Industry.
Du Pont Equation
Among all ratios, return on equity is very common. It shows the value of the firm. Improvement in the ROE is considered as valued addition to the firm. ROE can be linked with other ratios. Analysis of such ratios will indicate proper reason for a change in ROE. The combination is known as Du Pont equation which is shown below,
Explanation of Solution
Company B
Given,
Net income of the company is$27,300.
Sales of the company is $1,607,500.
Total asset is $947,500.
Total common equity is $361,000.
The Du point relation of the company’s ratios is shown below:
Substitute $27,300 for the net income, $1,607,500 for sales, and $947,000 for total assets and $361,000 for the total common equity.
Thus, the Du Pont equation of company is
Industry
Given,
ROE of industry is 9%.
Profit margin is1.20%.
Total assets turnover is 3.0 times.
Equity multiplier is 2.5 times(working note).
The DU Pont equation is,
Substitute 9% for ROE, 1.20 % for the profit margin, 3.0 times for the total assets turnover and 2.5 times for the equity multiplier in above formula.
Thus the Du Pont equation of Industry is
Working notes:
In case of industry, there is no equity multiplier. So, calculate equity multiplier.
Given,
Profit margin of the industry is1.2%.
Return on equity is 9.0%.
Total assets turnover ratio is 3.0 times.
Calculation of equity multiplier,
Thus, equity multiplier is 2.50 times.
Therefore, the Du Pont equation of Company B and Industry is outlined.
(c)
To outline: The strength and weakness of the company revealed by the analysis.
Answer to Problem 23P
The analysis shows the following data about the company.
| Ratios | Company | Industry |
| (a) Liquidity Ratio: | ||
| Current | 1.98x | 2.0x |
| Quick | 1.25x | 1.3x |
| (b) Assets Management: | ||
| Days sales outstanding | 76.29days | 35 days |
| Inventory turnover | 6.66x | 6.7x |
| Total assets turnover | 1.70x | 3.0x |
| (c) Debt Management: | ||
| Total debt to capital | 48.54% | 47.0% |
| TIE | 2.86% | 3.0x |
| (d) Profitability: | ||
| Profit margin | 1.70% | 1.20% |
| ROA | 2.88% | 3.60% |
| ROE | 7.56% | 9.0% |
| ROIC | 5.99% | 7.50% |
Table (1)
Explanation of Solution
- Liquidity ratio shows the ability to pay back short term dues. The figures of the company are almost at par with industry’s average. The liquidity seems strong.
- Assets management is the ability to utilize assets. Total assets turnover is low. The inventory turnover of the company is half of the industry but the day’s sales outstanding of the company is very high. Thus the company should improve the collection from account receivables.
- Debt management is the capability of the company to pay back its debts. Total debt/total capital of the company is higher than industry but times-interest-earned ratio (TIE) of the company is lower than industry.
- Profit margin of the company is higher as compared to industry. ROA,ROE and ROIC are below the industry’s average.
Therefore, based on above given points it can be said that the company liquidity is strong, assets management seems weak, the debt management is average and profitability can be considered strong.
(d)
To identify: The affect in the ratio analysis of the company supposing the company had doubled its sales as well as inventories, account receivables and common equity during 2016.
Answer to Problem 23P
If the company had doubled its sales, account receivables and inventory. The ratio analysis will be affected in the given way:
- Liquidity Ratios: When the inventory and account receivables are doubled, the current assets will increase. But there will be no change in the current liability. The current assets will be improved and it will also improve the quick ratio. Thus it can be said the liquidity ratio will be improved.
- Assets Management: There will be no change in days sales outstanding since both the numerator and denominators are doubled. Inventory ratio will remain unchanged because both the numerator and denominators are doubled. The assets turnover will be little improved as the sales will be doubled. The assets increase by a little amount.
- Total debt to capital: The equity will be doubled but debt will remain same. The proportion of debt to capital will be decreased. The solvency position of the company will be improved.
- Profitability: Company already has better profit margin than industry. If there is an increase in sales, the profit will also increase.
Explanation of Solution
If the account receivables and inventory are doubled, the total assets of the company will be increased and it will affect the asset turnover ratio slightly because the sales are also being doubled. So, it can be said there will be a little change in total assets ratio or can be unchanged also.
Therefore, if the sales, receivables, inventories and equities will be doubled, the liquidity, profitability and solvency will be improved but the assets utilization will remain same.
Want to see more full solutions like this?
Chapter 4 Solutions
Fundamentals of Financial Management, Concise Edition (MindTap Course List)


- RATIO ANALYSIS Data for Barry Computer Co. and its industry averages follow. a. Calculate the indicated ratios for Barry. b. Construct the DuPont equation for both Barry and the industry. c. Outline Barrys strengths and weaknesses as revealed by your analysis. d. Suppose Barry had doubled its sales as well as its inventories, accounts receivable, and common equity during 2015. How would that information affect the validity of your ratio analysis? (Hint: Think about averages and the effects of rapid growth on ratios if averages are not used. No calculations are needed.) Barry Computer Company: Balance Sheet as of December 31, 2015 (in Thousands) Cash 77,500 Accounts payable 129,000 Receivables 336,000 Other current liabilities 117,000 Inventories 241,500 Notes payable to bank 84,000 Total current assets 655,000 Total current liabilities 330,000 Long-term debt 256,500 Net fixed assets 292,500 Common equity 361,000 Total assets 947,500 Total liabilities and equity 947,500 Barry Computer Company: Income Statement for Year Ended December 31, 2015 (in Thousands) Sales 1,607,500 Cost of goods sold Materials 717,000 Labor 453,000 Heat, light, and power 68,000 Indirect labor 113,000 Depreciation 41,500 1,392,500 Gross profit 215,000 Selling expenses 115,000 General and administrative expenses 30,000 Earnings before interest and taxes (EBIT) 70,000 Interest expense 24,500 Earnings before taxes (EBT) 45,500 Federal and state income taxes (40%) 18,200 Net income 27,300 Ratio Barry Industry Average Current _____ 2.0 Quick _____ 1.3 Days sales outstandinga _____ 35 days Inventory turnover _____ 6.7 aCalculation is based on a 365-day year Total assets turnover _____ 3.0 Profit margin _____ 1.20% ROA _____ 0 ROE _____ 9.00% ROIC _____ 0 TIE _____ 3.0 Debt/Total capital _____ 47.00%arrow_forwardRATIO ANALYSIS Data for Barry Computer Co. and its industry averages follow. a. Calculate the indicated ratios for Barry. b. Construct the DuPont equation for both Barry and the industry. c. Outline Barrys strengths and weaknesses as revealed by your analysis. d. Suppose Barry had doubled its sales as well as its inventories, accounts receivable, and common equity during 2014. How would that information affect the validity of your ratio analysis? (Hint: Think about averages and the effects of rapid growth on ratios if averages are not used. No calculations are needed.) Barry Computer Company: Balance Sheet as of December 31, 2014 (in Thousands) Cash 77,500 Accounts payable 129,000 Receivables 336,000 Other current liabilities 117,000 Inventories 241,500 Notes payable to bank 84,000 Total current assets 655,000 Total current liabilities 330,000 Long-term debt 256,500 Net fixed assets 292,500 Common equity 361,000 Total assets 947,500 Total liabilities and equity 947,500 Barry Computer Company: Income Statement for Year Ended December 31, 2014 (in Thousands) Sales 1,607,500 Cost of goods sold Materials 717,000 Labor 453,000 Heat, light, and power 68,000 Indirect labor 113,000 Depredation 41,500 1,392,500 Gross profit 215,000 Selling expenses 115,000 General and administrative expenses 30,00 Earnings before interest and taxes (EBIT) 70,000 Interest expense 24,500 Earnings before taxes (EBT) 45,500 Federal and state income taxes (40%) 18,200 Net income 27,300 Ratio Barry Industry Average Current ___ 2.0x Quick ___ 1.3x Days sales outstandinga ___ 35 days Inventory turnover ___ 6.7x Total assets turnover ___ 3.0x Profit margin ___ 12% aCalculation is based on a 365 day year. Ratio Barry Industry Average ROA ___ 3.6% ROE ___ 9.0% ROIC ___ 7.5% TIE ___ 3.0x Debt/Total capital ___ 47.0%arrow_forwardPlease find below Financial Statement extracts of Nestle from year 2017 and 2018. Based on this information please answer following question from a perspective of Financial Analyst (justify your answers with data as well the reason for choosing your ratios for your analysis) .The company’s total assets at year-end 2016 were CHF 131,900 million. What reasonable conclusions an analyst might make about the companies efficiency, Companies solvency, Liquidity and Profitability? In millions of CHF Notes 2018 2017 * Sales 3 91,439 89,590 Cost of goods sold (46,070) (45,571) Trading operating profit 3 13,789 13,277 Operating profit 13,752 10,156 Profit before taxes, associates and joint ventures 12,991 9,460 Taxes 13 (3,439) (2,773) Profit for the year 10,468 7,511 Notes 2018 2017 * Assets Current assets Cash and cash equivalents 12/16…arrow_forward
- You are provided with the Income Statement and the Balance Sheet of HTS software, Inc. for 2011. Required: (a) Calculate the ratios stated in the table below for HTS Software, Inc. for 2011 (b) Analyze the current financial position for the company from a time series and cross section viewpoint. (c) Break your analysis into an evaluation of the firm’s liquidity, activity, debt, profitability and market ratios. Historical and Industry Average Ratios HTS Software , Inc. Ratio 2010 2011 Industry2011 Current Ratio 2.6 — 2.7 Quick Ratio 1.8 — 1.75 Inventory Turnover 4.5 — 4.7 Average Collection Period 40days — 42 days Total Asset Turnover 1.2 — 1 Debt Ratio 20% — 21% Times Interest Earned 9 — 8.9 Gross Profit Margin 43% — 44% Operating Profit Margin 30% — 32% Net Profit Margin 20% — 21% Return on total assets 12% — 13% Return on Equity Price/Earnings Ratio…arrow_forwardYou are provided with the Income Statement and the Balance Sheet of HTS software, Inc. for 2011. Required: (a) Calculate the ratios stated in the table below for HTS Software, Inc. for 2011 (b) Analyze the current financial position for the company from a time series and cross section viewpoint. (c) Break your analysis into an evaluation of the firm’s liquidity, activity, debt, profitability and market ratios. Historical and Industry Average Ratios HTS Software , Inc. Ratio 2010 2011 Industry2011 Current Ratio 2.6 — 2.7 Quick Ratio 1.8 — 1.75 Inventory Turnover 4.5 — 4.7 Average Collection Period 40days — 42 days Total Asset Turnover 1.2 — 1 Debt Ratio 20% — 21% Times Interest Earned 9 — 8.9 Gross Profit Margin 43% — 44% Operating Profit Margin 30% — 32% Net Profit Margin 20% — 21% Return on total assets 12% — 13% Return on Equity Price/Earnings Ratio…arrow_forwardRATIO ANALYSIS The Corrigan Corporation’s 2017 and 2018 financial statements follow,along with some industry average ratios.a. Assess Corrigan’s liquidity position, and determine how it compares with peers andhow the liquidity position has changed over time.b. Assess Corrigan’s asset management position, and determine how it compares withpeers and how its asset management efficiency has changed over time.c. Assess Corrigan’s debt management position, and determine how it compares withpeers and how its debt management has changed over time.d. Assess Corrigan’s profitability ratios, and determine how they compare with peersand how its profitability position has changed over time.e. Assess Corrigan’s market value ratios, and determine how its valuation compares withpeers and how it has changed over time. Assume the firm’s debt is priced at par, sothe market value of its debt equals its book value. f. Calculate Corrigan’s ROE as well as the industry average ROE, using the DuPontequation.…arrow_forward
- A company’s comparative statements are given below. Please conduct the following analyses: c. Calculate the three profitability ratios for year 2017 and show how ROE can be derived from the DuPont formula for this company. d. What do the analyses tell you about the company’s financial performance?arrow_forwardThe Corrigan Corporation’s 2015 and 2016 financial statements follow,along with some industry average ratios.a. Assess Corrigan’s liquidity position, and determine how it compares with peers and how the liquidity position has changed over time.b. Assess Corrigan’s asset management position, and determine how it compares with peers and how its asset management efficiency has changed over time.c. Assess Corrigan’s debt management position, and determine how it compares with peers and how its debt management has changed over time.d. Assess Corrigan’s profitability ratios, and determine how they compare with peers and how its profitability position has changed over time.e. Assess Corrigan’s market value ratios, and determine how its valuation compares with peers and how it has changed over time.f. Calculate Corrigan’s ROE as well as the industry average ROE, using the DuPont equation. From this analysis, how does Corrigan’s financial position compare with the industry average numbers?g.…arrow_forwardBased on this analysis how would I assess the financial stability and operational efficiency of this company? Ratio and Ratio Formula (in thousands) 2015 2014 2013 Current Industry Average Liquidity Current Ratio =Current Asset / Current Liability 9,900/6,300 1.57 1.61 1.62 1.63 Acid Test Ratio or Quick Ratio = (Cash + Marketable securities + Accounts receivable)/Current liabilities (400+300+3,200)/6,300 0.62 0.64 0.63 0.68 Solvency Times Interest Earned =Earnings before interest & taxes/interest expense, gross (7,060+900)/900 8.84 8.55 8.5 8.45 Profitability Profit margin on sales = net income/sales 7,060/30,500 14% 13.20% 12.10% 13.00% Productivity Asset turnover = sales/avg total assets 30,500/6,000+5,400)/2) 1.85 1.84 1.83 1.84 Inventory turnover = COGS/avg inv 17,600/ (6,000+5,400)/2) 3.09 3.17 3.21 3.18arrow_forward
- What is the comparison (analysis) of the Quick Ratio of Industry Average Ratio and the Company A Ratio? The quick ratios has decreased and increased. Why? Industry Average Quick Ratios 2015: 2.78 2016: 2.82 2017: 1.48 2018: 1.21 2019: 1.54 Company A Quick Ratio 2015: 2.78 2016: 2.02 2017: 2.35 2018: 0.12 2019: 0.26arrow_forwardWhat is the comparison (analysis) of the Current Ratio of Industry Average Ratio and the Company A Ratio? The current ratios has decreased and increased. Why? Industry Average Current Ratio 2015: 3.11 2016: 3.18 2017: 1.75 2018: 1.77 2019: 2.19 Company A Current Ratio 2015: 3.02 2016: 2.25 2017: 2.56 2018: 1.74 2019: 1.60arrow_forwardIf given the opportunity, in which of the firms would you invest based on the result of your analysis of both companies and the comparison with the industry? If you would not invest, explain your reasons according to the results obtained. Company Name: Year 2018 Chemicals and Allied Products Industry Ratios ………….. Solvency or Debt Ratios Merck J&J 2018 Debt ratio 0.67 0.61 0.47 Debt-to-equity ratio 0.93 0.51 0.38 Interest coverage ratio 12.27 18.91 -9.43 Liquidity Ratios Current ratio 1.17 1.47 3.47 Quick ratio 0.92 1.16 2.12 Cash ratio 0.40 0.63 2.24 Profitability Ratios Profit margin 14.64% 18.75% -93.4% ROE (Return on equity), after tax 23.03% 25.60% -248.5 ROA (Return on assets) 7.49% 10.00% -146.5 Gross margin 68.06% 66.79% 55.3% Operating margin (Return on sales) 19.62% 24.27%…arrow_forward
 Fundamentals of Financial Management, Concise Edi...FinanceISBN:9781305635937Author:Eugene F. Brigham, Joel F. HoustonPublisher:Cengage Learning
 Fundamentals of Financial Management (MindTap Cou...FinanceISBN:9781285867977Author:Eugene F. Brigham, Joel F. HoustonPublisher:Cengage Learning
 Fundamentals of Financial Management, Concise Edi...FinanceISBN:9781285065137Author:Eugene F. Brigham, Joel F. HoustonPublisher:Cengage Learning
 EBK CONTEMPORARY FINANCIAL MANAGEMENTFinanceISBN:9781337514835Author:MOYERPublisher:CENGAGE LEARNING - CONSIGNMENT
 Financial Reporting, Financial Statement Analysis...FinanceISBN:9781285190907Author:James M. Wahlen, Stephen P. Baginski, Mark BradshawPublisher:Cengage Learning