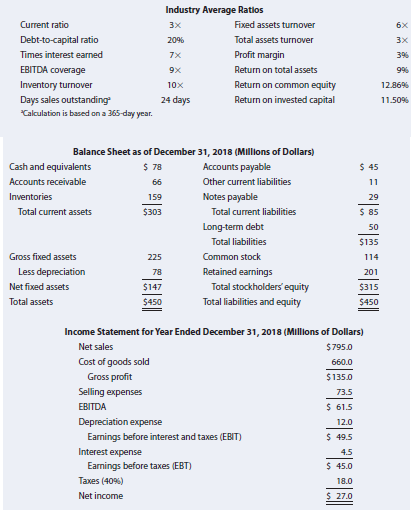
Industry Average Ratios Current ratio Fixed assets turnover Debt-to-capital ratio 20% Total assets turnover Times interest earned 7X Profit margin EBITDA coverage Return on total assets Return on common equity Inventory turnover Days sales outstanding Calculation is based on a 365-day year. 10x 12.86% 24 days Return on invested capital 11.50% Balance Sheet as of December 31, 2018 (Millions of Dollars) Cash and equivalents $ 78 Accounts payable $ 45 Accounts receivable 66 Other current liabilities 11 Inventories 159 Notes payable 29 Total current assets $303 Total current liabilities $ 85 Long-term debt 50 Total liabilities $135 Gross fixed assets 225 Common stock 114 Less depreciation Retained earnings 78 201 Total stockholders equity Total liabilities and equity Net fixed assets $147 $315 Total assets $450 $450 Income Statement for Year Ended December 31, 2018 (Millions of Dollars) Net sales $795.0 Cost of goods sold 660.0 Gross profit $135.0 Selling expenses EBITDA 73.5 $ 61.5 Depreciation expense 12.0 Earnings before interest and taxes (EBIT) 49.5 Interest expense 4.5 Earnings before taxes (EBT) $ 45.0 Taxes (40%) 18.0 Net income $ 27.0


A firm has been experiencing low profitability in recent years. Perform
an analysis of the firm’s financial position using the DuPont equation. The firm has no lease
payments but has a $2 million sinking fund payment on its debt. The most recent industry
average ratios and the firm’s financial statements are as follows:
a. Calculate the ratios you think would be useful in this analysis.
b. Construct a DuPont equation, and compare the company’s ratios to the industry average
ratios.
c. Do the balance sheet accounts or the income statement figures seem to be primarily
responsible for the low profits?
d. Which specific accounts seem to be most out of line relative to other firms in the industry?
e. If the firm had a pronounced seasonal sales pattern or if it grew rapidly during the
year, how might that affect the validity of your ratio analysis? How might you correct
for such potential problems?


Trending now
This is a popular solution!

Step by step
Solved in 6 steps with 16 images


