
Videos
FINANCIAL STATEMENTS AND TAXES Part I of this case, presented in Chapter 3, discussed the situation of D'Leon Inc., a regional snack foods producer, after an expansion program. D'Leon had increased plant capacity and undertaken a major marketing campaign in an attempt to "go national.” Thus far, sales have not been up to the
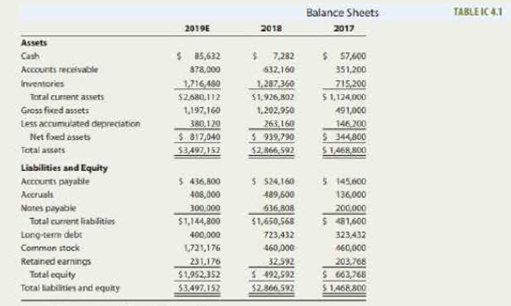
Donna Jamison was brought in as assistant to Fred Campo, D'Leon's chairman, who had the task of getting the company back into a sound financial position. D'Leon's 2017 and 2018 balance sheets and income statements, together with projections for 2019, are given in Tables IC 4.1 and 1C 4.2- In addition, Table IC 4.3 gives the company's 2017 and 2018 financial ratios, together with industry average data. The 2019 projected financial statement data represent Jamison's and Campo’s best guess for 2019 results, assuming that some new financing is arranged to get the company "over the hump"
Jamison examined monthly data for 2018 (not given in the case), and she detected an improving pattern during the year. Monthly sales were rising, costs were falling, and large losses in the early months had turned to a small profit by December. Thus, the annual data look somewhat worse than final monthly data. Also, it appears to be taking longer for the advertising program to get the message out, for the new sales offices to generate sales, and for tire new manufacturing facilities to operate efficiently. In other words, the lags between spending money and deriving benefits were longer than D'Leon's managers had anticipated. For these reasons, Jamison and Campo see hope for the company-provided it can survive in the short run.
Jamison must prepare an analysis of where the company is now, what it must do to regain its financial health, and what actions should be taken. Your assignment is to help Irer answer the following questions. Provide clear explanations, not yes or no answers.
- a. Why are ratios useful? What are the five major categories of ratios?
- b. Calculate D'Leon's 2019 current and quick ratios based on the projected balance sheet and income statement data. What can you say about the company's liquidity positions in 2017, in 2018. and as projected for 2019? We often think of ratios as being useful (1) to managers to help run the business, (2) to bankers for credit analysis, and (3) to stockholders for stock valuation. Would these different types of analysts have an equal interest in the company's liquidity ratios? Explain your answer.
- c. Calculate the 2019 inventory turnover, days sales outstanding (DSO), fixed assets turnover, and total assets turnover. How does D'Leon's utilization of assets stack up against other firms in the industry?
- d. Calculate the 2019 debt-to-capital and times-interest-earned ratios. How does D’Leon compare with the industry with aspect to financial leverage? What can you conclude from these rations?
- e. Calculate the 2019 operating margin, profit margin, basic earning power (BET),
return on assets (ROA),return on equity (ROE), andreturn on invested capital (ROIC) What can you say about these ratios? - f. Calculate the 2019 price/earnings ratio and market /book ratio. Do these ratios indicate that investors are expected to have a high or low opinion of the company?
- g. Use the DuPont equation to provide a summary and overview of D'Leon's financial condition as projected for 2019. What are the firm's major strengths and weaknesses?
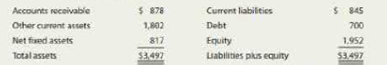
- h. Use the following simplified 2019 balance sheet to show, in general terms, how an improvement in the DSO would tend to affect the stock price. For example, if the company could improve its collection procedures a ml thereby lower its DSO from 45.6 days to the 32-day industry average without affecting sales, how would that change "ripple through" the financial statements (shown in thousands below) and influence the stock price?
- i. Does it appear that inventories could be adjusted? If so, how should that adjustment affect D'Leon's profitability and stock price?
- j. In 2018, the company paid its suppliers much later than the due dates; also, it was not maintaining financial ratios at levels called for in its bank loan agreements. Therefore, suppliers could cut the company off, and its bank could refuse to renew the loan when it comes due in 90 days. On the basis of data provided, would you, as a credit manager, continue to sell to D'Leon on credit?(You could demand cash on delivery-that is, sell on terms of COD-but that might cause D'Leon to stop buying from your company.) Similarly, if you were the bank loan officer, would you recommend renewing the loan or demanding its repayment? Would your actions be influenced if, in early 2019, D'Leon showed you its 2019 projections along with proof that it was going to raise more than $1.2 million of new equity?
- k. in hindsight. What should D'Leon have done in 2017?
- l. What are some potential problems and limitations of financial ratio analysis?
- m. What are some qualitative factors that analysts should consider when evaluating a company's likely future financial performance?
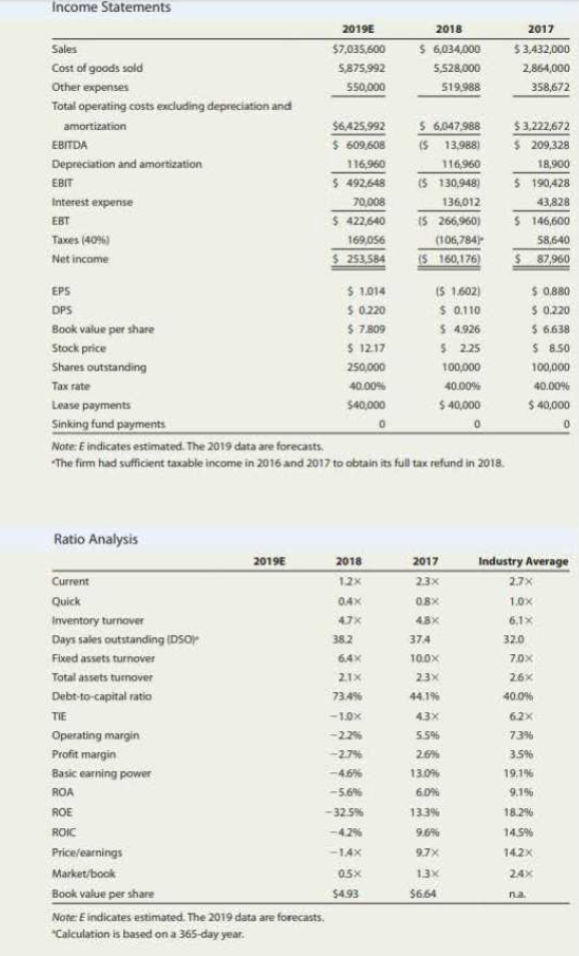
Note E indicated estimated. The 2019 date are forecasts.
a Calculated is based on a 365-day year.
a.
To determine: The usefulness of ratios and the 5 main categories of ratios.
Ratio Analysis:
Ratios are used to compare two arithmetical figures. In case of the ratio analysis of the company, the financial ratios are calculated. The financial ratios examine the performance of the company and are used to compare with other business. It indicates relationship of two or more parts of the financial statements.
Explanation of Solution
The uses of ratios are as follows:
- Ratios help the manager to know the performance of the company and take necessary steps to improve the company’s performance.
- Ratios help lenders in calculating the repayment of debts.
- Ratios help stockholders in forecasting future dividends and earnings.
The 5 main categories of ratios are as follows:
- Liquidity ratios.
- Profitability ratios.
- Debt management ratios.
- Market value ratios and
- Asset management ratios.
b.
To determine: The current and quick ratio for the year 2019, the company liquidity potion for 2017, 2018, and 2019 and all the analysts have equal interest in company liquidity ratio.
Introduction:
Liquidity is a term used to define a company’s ability to repay its obligations on time. It is analyzed as a part of evaluation of that company. The lender and potential investors of a firm consider it before making decision related to a company.
Explanation of Solution
Current ratio
2019
Given information:
Current asset is $2,680,112.
Current liabilities is $1,144,800.
The formula to calculate current ratio is as follows:
To calculate current ratio is as follows:
Hence, the current ration of the year 2019 is 2.34 times.
Quick ratio:
2019
Given information:
Current asset is $2,680,112.
Current liabilities is $1,144,800.
Inventories is $1,716,480.
The formula to calculate quick ratio is as follows:
To calculate quick ratio is as follows:
Hence, the quick ratio for the year 2019 is 0.842 times.
Yes, all the analysts have equal importance in the company liquidity ratio.
Therefore, the company liquidity position as increased from 2018 and is close to 2017. However, it is below the industry average.
c.
To determine: The inventory turnover ratio, days sales outstanding ratio, fixed asset turnover ratio, and total assets turnover ratio for the year 2019.
Introduction:
Financial Ratio Analysis: Financial ratio analysis is one of the tools of financial analysis of a firm. It represents the relationship between two or more items of the financial statement.
Explanation of Solution
Inventory turnover ratio:
Given information:
2019
Sales is $7,035,600.
Inventory is $1,716,480.
Formula to calculate inventory turnover ratio is as follows:
To calculate inventory turnover ratio is as follows:
Hence, the inventory turnover ratio for the year 2019 is 4.10 times.
Days sales outstanding ratio:
Given information:
2019
Sales is $7,035,600.
Account receivables is $878,000.
Formula to calculate days sales outstanding ratio is as follows:
To calculate days sales outstanding ratio is as follows:
Hence, the day’s sales outstanding ratio for the year 2019 is 45.549 days.
Fixed asset turnover ratio:
Given information:
2019
Sales is $7,035,600.
Net fixed asset is $814,040.
Formula to calculate fixed asset turnover ratio is as follows:
To calculate fixed asset turnover ratio is as follows:
Hence, the fixed asset turnover ratio for the year 2019 is 8.61 times.
Total asset turnover ratio:
Given information:
2019
Sales is $7,035,600.
Total asset is $3,497,152.
Formula to calculate total asset turnover ratio is as follows:
To calculate total asset turnover ratio is as follows:
Hence, the total asset turnover ratio for the year 2019 is 2.011 times.
Therefore, the total assets turnover and inventory turnover ratios of the firm are slowly declining, while there is increase in days sales outstanding ration (it indicated bad sign for the firm). The total assets turnover ratio is marginally below the 2015 level. The fixed asset turn over ration is low in the year 2019 compared to 2017.
d.
To determine: The debt-to capital and times-interest-earned ratio, the manner in which Firm D compares the industry with respect to financial leverage and the conclusion from these ratios.
Explanation of Solution
Debt-to capital ratio:
Given information:
2019
Notes payable (short-term debt) is $300,000.
Long-term debt is $400,000.
Total equity is $1,952,352.
NOTE:
Total debt includes
Total invested capital includes
Formula to calculate the debt-to-capital ratio is as follows:
To calculate the debt-to-capital ratio is as follows:
Hence, the debt-total-capital ratio for the year 2019 is 26.39%.
Times-interest-earned ratio:
Given information:
2019
EBIT is $492,648.
Interest is $70,008.
Formula to calculate the times-interest-earned ratio is as follows:
To calculate the times-interest-earned ratio is as follows:
Hence, the times-interest-earned ratio for the year 2019 is 7.04 times.
Comparison:
The debt-to capital ratio of the firm is improved compared to 2018 and 2017 and below the industry average (it indicates good sign for the firm). The time-interest-earned ratio has also increased compared to 2018 and 2019 and it is above the industry average.
Therefore, improvement in both debt-to-capital ratio and time-interest-earned ration indicated good sign for the company.
e.
To determine: The operating margin, profit margin, basic earning power, return on assets, return on earnings, and return on invested capital and comment on these ratios.
Explanation of Solution
Operating margin ratio:
Given information:
2019
EBIT is $492,648.
Sales is $7,035,600.
Formula to calculate the operating margin ratio is as follows:
To calculate the operating margin ratio is as follows:
Hence, the operating margin ratio for the year 2019 is 7%.
Profit margin ratio:
Given information:
2019
Net income is $253,584.
Sales is $7,035,600.
Formula to calculate the Profit margin ratio is as follows:
To calculate the Profit margin ratio is as follows:
Hence, the profit margin ratio for the year 2019 is 3.06%.
Basic earning power ratio:
Given information:
2019
EBIT is $492,648.
Tax 40%
Total assets is $3,497,152.
Formula to calculate the Basic earning power ratio is as follows:
To calculate the Basic earning power ratio is as follows:
Hence, the basic earning power ratio for the year 2019 is 14.09%.
Return on assets ratio:
Given information:
2019
Net income is $253,584.
Total assets is $3,497,152.
Formula to calculate the Return on assets ratio is as follows:
To calculate the Return on assets ratio is as follows:
Hence, the return on asset ratio for the year 2019 is 7.25%.
Return on equity ratio:
Given information:
2019
Net income is $253,584.
Common equity is $1,952,352.
Formula to calculate the Return on equity ratio is as follows:
To calculate the Return on equity ratio is as follows:
Hence, the return on equity for the year 2019 is 12.99%.
Return on invested capital:
Given information:
2019
EBIT is $492,648
Notes payable (short-term debt) is $300,000.
Long-term debt is $400,000.
Total equity is $1,952,352.
NOTE:
Total invested capital includes
Formula to calculate the Return on invested capital ratio is as follows:
To calculate the Return on invested capital ratio is as follows:
Hence, the return on invested capital for the year 2019 is 11.14%.
Therefore, the operating margin of the firm is high than 2017 and 2018, but slightly low than in industry average. The profit margin of the firm is high than 2017 and 2018 and slightly high than in industry average. The basic earning power, return on invested capital, and return on assets have increased in 2019 compared to 2017 and 2018, but the industry average is low. The return on equity of the firm is improved compared to 2018 but low than 2017 and low than in industry average.
f.
To determine: The price/ earnings ratio and market/ book ratio for the year 2019. The investor’s opinion on these ratios.
Explanation of Solution
Price/ earnings ratio:
Given information:
2019
Net income is $253,584.
Outstanding shares is $250,000.
Stock price is $12.17
Common equity is $1,952,352.
Formula to calculate the earnings per share is as follows:
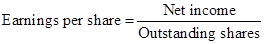
To calculate the earnings per share ratio is as follows:
Hence, the earnings per share for the year 2019 is $1.0143.
Formula to calculate the price/ earnings ratio is as follows:
To calculate the price/ earnings ratio is as follows:
Hence, the price/ earnings ratio for the year 2019 is 12 times.
Market/Book ratio
Formula to calculate the book value per share ratio is as follows:
To calculate the book value per share ratio is as follows:
Hence, the book value per share ratio for the year 2019 is $7.81.
Formula to calculate the Market/Book ratio is as follows:
To calculate the Market/Book ratio is as follows:
Hence, the Market/Book ratio for the year 2019 is $1.56 times.
If these ratios are high in the company, the investor will have good opinion on the company.
Therefore, both these ratios have increase in 2019 compared to 2017 and 2018, but low than the industry average.
g.
To explain: The summary and overview of Company D financial condition using DuPont equation and the major weaknesses and strengths of the firm.
Explanation of Solution
DuPont equation
Formula to calculate DuPont equation is as follows:
Note
Equity multiplier includes total assets divided by total equity.
To calculate DuPont equation is as follows:
Hence, the DuPont equation for the year 2019 is $12.96%.
The strengths and weaknesses of the firm are as follows:
Strengths:
- The fixed asset turnover ratio of the firm is higher than its industry average that indicated good sign for the company.
- The profit margin of the company has increased slightly than the industry average and the debt-to capital ratio of the firm has decreased that is good for the company. in return the firm would reduce its operating cost and interest expenses.
- The time-interest-earned ratio of the firm is above the industry average higher this ration indicates higher interest earned by the firms.
Weaknesses:
- The current ratio of the firm is low that indicates the firm is not able to able its current debt.
- All most all the asset management ratios performance are poor except fixed asset turnover ratio.
- Only profit margin ratio of the company is performing well in profitability rations all other profitability ratios are low than the industry average.
- The market value ratios of the firm are low.
h.
To explain: The manner in which improvement in days sales outstanding would affect the stock price.
Explanation of Solution
Reduction in day’s sales outstanding and accounts receivable will give additional cash in the beginning. The freed cash can be used in expanding their business, reducing their debt, and in repurchasing stock. Improvement in all these actions will result in improvement in stock price.
Working notes:
Formula to compute sales per day is as follows:
Compute sales per day is as follows:
Therefore, the sales per day is $19,275.62.
Formula to compute accounts receivables under new policy is as follows:
Compute accounts receivables under new policy is as follows:
Hence, the account receivables under new policy is $616,820.
Formula to compute freed cash is as follows:
Compute freed cash is as follows:
Hence, the freed cash is $261,180.
i.
To explain: The way inventories would be adjusted and the way these adjustments affect Company D stock price and profitability.
Explanation of Solution
The firm as the lower inventory turnover ratio that indicated the firm as either unnecessary inventory or an outdated inventory. The reduction in such assets will result in the improvement of current assets ratio.
Increase in total asset turnover ratio and inventory will reduce debt-to-capital ratio that will improve the profitability and stock price of the company.
j.
To explain: Whether as a credit manager Person X would countinue to extend the credit to Company with not maintaing proper financial ratios.
Explanation of Solution
The Person X as a credit manager will not continue to extended the credit for the Company D because the company current ratio is low and most of the financial ratios are low than the industry average.
k.
To explain: The measures that should have been taken by Company D in 2017.
Explanation of Solution
The firm must have done ratio analysis before expanding its business. The ratio analysis would help the managers to know the financial performance of the company.
l.
To discuss: The limitations and potential problems in analyzing the financial ratios.
Explanation of Solution
The limitations and potential problems in analyzing the financial ratios is as follows:
- Suppose the firm is operating in several different divisions, then comparing with industry average would be difficult.
- There may the misrepresentation in comparisons Due to several accounting practices and operations.
- In few cases, it may be hard to decide whether the ratio is bad or good.
- It is difficult to analyze the company position whether weak or strong.
- The ratios can distort seasonal factors.
- It is necessary that the ratio analysis or comparative analysis must be construed with a judgment.
m.
To discuss: The factors that must be considered by the analysts while evaluating the company.
Explanation of Solution
The factors that must be considered by the analysts while evaluating the company. is as follows:
- Whether the company revenue is tied to one customer.
- The analysts should know to what extent revenue of the company is tied on one product.
- Should know the percentage of business generated externally.
- The competition faced by the company in the market.
- How much percentage the company invest in research and development and whether it is necessary for the company to invest in research and development.
- Whether changes in laws and regulations will have major implication for the companies.
Want to see more full solutions like this?
Chapter 4 Solutions
Fundamentals of Financial Management (MindTap Course List)


- Various Contingency Issues Skinner Company has the following contingencies: 1. Potential costs due to the discovery of a possible defect related to one of its products. These costs are probable and can be reasonably estimated. 2. A potential claim for damages to be received from a lawsuit filed this year against another company. It is probable that proceeds from the claim will be received by Skinner next year. 3. Potential costs due to a promotional campaign in which a cash refund is sent to customers when coupons are redeemed. Skinner estimated, based on past experience, that 70% of the coupons would be redeemed. Forty percent of the coupons were actually redeemed and the cash refunds sent this year. The remaining 30% of the coupons are expected to be redeemed next year. Required: 1. How should Skinner report the potential costs due to the discovery of a possible product defect? Explain why. 2. How should Skinner report this year the potential claim for damages that may be received next year? Explain why. 3. This year, how should Skinner account for the potential costs and obligations due to the promotional campaign?arrow_forwardYour company has always depreciated assets using the straight-line method. Your tax accountant has explained that a switch to the double-declining balance method would minimize taxes in the current year, but you are concerned about the impact this change would have on the value of long-term assets on the balance sheet and future tax liabilities. Respond to the following in a minimum of 175 words: Assuming your projected sales (and therefore tax bracket) are predicted to increase dramatically over the next 5 years, what should you do?arrow_forwardLIFO was designed to protect cash flow in industries where prices increase rapidly. It has been used for both tax and financial statement reporting since the 1930s. The higher cost of goods sold under LIFO in these circumstances results in lower reported profit than under FIFO. In the 2012 budget, President Obama has threatened to repeal LIFO. If Exxon uses FIFO for its inventory valuation, calculate the cost of ending inventory and cost of goods sold if ending inventory is 100 barrels of crude oil: Beginning inventory and purchasesBarrelsBarrel costTotal costJanuary 1120$ 94$ 11,280March 1451034,635June 160975,820September 170926,440December 1451024,590 340 $ 32,765. What is the cost of ending inventory: ? What is the cost of goods sold: ?arrow_forward
- How would answer this question? You are estimating your company's external financing needs for the next year. Your first-pass pro forma financial statements showed a large financing deficit for next year. Which of the following changes to your company's operating plan would reduce the financing deficit if incorporated in revised pro forma financial statements? None of the options are correct. Increase cost of goods sold as a percentage of sales Increase the dividend payout ratio Increase the sales growth rate Reduce the collection periodarrow_forwardA firm is considering several policy changes to increase sales. It will increase inventory by $10,000 it will offer more liberal sales terms but will result in average receivables increasing by $65,000. These actions are expected to increase sales by $800,000 per year, and cost of goods will remain at 80% of sales. Because of the firm’s increased purchase of its won production needs, average payable increases by $35,000.What factors should they consider when making these decisions? What effects would they have on the firm’s cash cycle? Please select three financial ratios they should consider and whyarrow_forwardII. Jerry Prior, Beeler Corporation’s controller, is concerned that net income may be lower this year. He is afraid upper-level management might recommend cost reductions by laying off accounting staff including him. Prior knows that depreciation is a major expense for Beeler. The company currently uses the double-declining-balance method for both financial reporting and tax purposes, and he’s thinking of selling equipment that, given its age, is primarily used when there are periodic spikes in demand. The equipment has a carrying value of $2,000,000 and a fair value of $2,180,000. The gain on the sale would be reported in the income statement. He doesn’t want to highlight this method of increasing income. He thinks, “Why don’t I increase the estimated useful lives and the salvage values? That will decrease depreciation expense and require less extensive disclosure, since the changes are accounted for prospectively. I may be able to save my job and those of my staff.” Instructions…arrow_forward
- A Corporation generated these gross profits during the past recent years when the sales price was 10% lower during 2020 compared to 2019. 2020 Sales P1,944,000; 2020 Cost of Sales P1,152,000; 2019 Sales P1,900,800; 2019 Cost of Sales P1,113,600. The decrease in gross profit due to decrease in selling price must be * P216,000 P194,400 P172,800 P189,600arrow_forwardA Corporation generated these gross profits during the past recent years when the sales price was 10% lower during 2020 compared to 2019. 2020 Sales P1,944,000; 2020 Cost of Sales P1,152,000; 2019 Sales P1,900,800; 2019 Cost of Sales P1,113,600. The decrease in gross profit due to decrease in selling price must be The change in gross profit due to change in quantity sold must be * P151,896 UF P259,200 F P107,304 UF P107,304 Farrow_forwardBotticelli Inc. was organized in late 2018 to manufacture and sell hosiery. At the end of its fourth year of operation, the company has been fairly successful, as indicated by the following reported net incomes. 2018 $140,000a 2020 $205,000 2019 160,000b 2021 276,000 a Includes a $10,000 increase because of change in bad debt experience rate. b Includes a gain of $30,000. The company has decided to expand operations and has applied for a sizable bank loan. The bank officer has indicated that the records should be audited and presented in comparative statements to facilitate analysis by the bank. Botticelli Inc. therefore hired the auditing firm of Check & Doublecheck Co. and has provided the following additional information. 1. In early 2019, Botticelli Inc. changed its estimate from 2% of receivables to 1% on the amount of bad debt expense to be charged to operations. Bad debt expense for 2018, if a 1% rate had been used, would have been…arrow_forward
- Menendez Corporation expects to sell $ 12 million. Costs, excluding depreciationtion, will represent 75% of sales and a depreciation of $ 1.5 million is expected.Sales will be collected in cash and all costs less depreciation will bebe settled during the year. The federal and state tax rate is 40%.to. Prepare an income statement. What will the company's expected net cash flow be?b. Suppose that Congress modified the tax laws and that doubled thecompany pricing. There were no changes in operations. How would it affectThat in recorded earnings and net cash flow?c. Now suppose that Congress did not double depreciation but reduced it byfifty%. How will that affect net cash flow?d. If it were your company, would you prefer Congress to double depreciation spendingtion or cut it in half? Explain your answer.arrow_forwardPlease Solve This Question Question 1 The Alpha Beta Company is attempting to establish a current assets policy. Fixed assets are $700,000, and the firm plans to maintain a 40% debt-to-assets ratio. Alpha Beta has no operating current liabilities. The interest rate is 12% on all debt. Three alternative current asset policies are under consideration: 30%, 40%, and 70% of projected sales. The company expects to earn 18% before interest and taxes on sales of $5 million. Alpha Beta’s effective federal-plus-state tax rate is 30%. What is the expected return on equity under each asset policy?arrow_forward
 Financial Reporting, Financial Statement Analysis...FinanceISBN:9781285190907Author:James M. Wahlen, Stephen P. Baginski, Mark BradshawPublisher:Cengage Learning
 Financial Accounting: The Impact on Decision Make...AccountingISBN:9781305654174Author:Gary A. Porter, Curtis L. NortonPublisher:Cengage Learning
 Intermediate Accounting: Reporting And AnalysisAccountingISBN:9781337788281Author:James M. Wahlen, Jefferson P. Jones, Donald PagachPublisher:Cengage Learning
 Fundamentals of Financial Management (MindTap Cou...FinanceISBN:9781337395250Author:Eugene F. Brigham, Joel F. HoustonPublisher:Cengage Learning
 Fundamentals of Financial Management (MindTap Cou...FinanceISBN:9781285867977Author:Eugene F. Brigham, Joel F. HoustonPublisher:Cengage Learning
 Fundamentals Of Financial Management, Concise Edi...FinanceISBN:9781337902571Author:Eugene F. Brigham, Joel F. HoustonPublisher:Cengage Learning