
Concept explainers
Videos
a.
Find the mean of the number of members per component.
Find the median of the number of members per component.
Find the standard deviation of the number of members per component.
a.
Answer to Problem 36CE
The mean of the number of members per component is 348.5.
The median of the number of members per component is 276.
The standard deviation of the number of members per component is 277.4.
Explanation of Solution
Calculation:
Step by step procedure to obtain mean, median and standard deviation using MINITAB software is given as,
- Choose Stat > Basic Statistics > Display
Descriptive Statistics . - In Variables enter the columns Membership.
- Choose option statistics, and select Mean, Median, Standard deviation.
- Click OK.
Output using MINITAB software is given below:
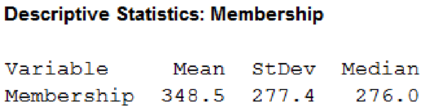
Hence, mean of the number of members per component is 348.5, the median is 276 and the standard deviation is 277.4.
b.
Find the coefficient of skewness.
Identify the shape of the distribution of component size.
b.
Answer to Problem 36CE
The coefficient of skewness is 1.17.
The shape of the distribution of component size is positive skewness.
Explanation of Solution
Calculation:
Step by step procedure to obtain skewness using MINITAB software is given as,
- Choose Stat > Basic Statistics > Graphical Summary.
- In Variables enter the columns Membership.
- Click OK.
Output using MINITAB software is given below:
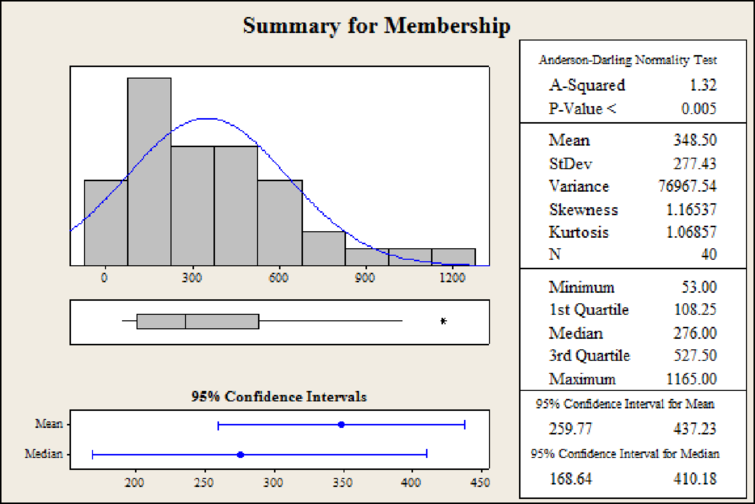
Hence, the value of coefficient of skewness is 1.17.
From the plot, it can be observed that most of the values are extended towards right indicating that distribution of component size is skewed to the right or positively skewed.
c.
Find the first
Find the third quartile.
c.
Answer to Problem 36CE
The first quartile is 108.25.
The third quartile is 527.50.
Explanation of Solution
Calculation:
Location of percentile:
The formula for percentile is,
In the formula, P denotes the location of the percentile and n denotes the total number of observations.
First quartile:
The first quartile represents the 25% of observation lies below first quartile. That is
Substitute,
The position of first quartile is 10.25th value in the dataset.
Hence, the first quartile is 108.25.
Third quartile:
The third quartile represents the 75% of observation lies above third quartile. That is
Substitute,
The position of third quartile is 30.75th value in the dataset.
Hence, the third quartile is 527.50.
d.
Construct a boxplot.
Identify whether there are outliers or not.
Find the components that are outliers.
Find the limits for outliers.
d.
Answer to Problem 36CE
The boxplot is,
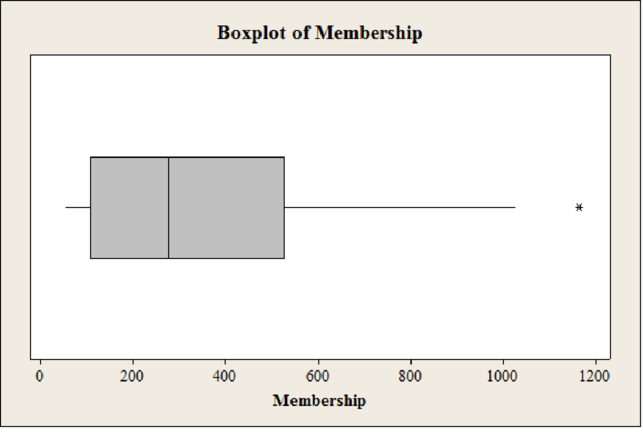
Yes, there are outliers.
The limits for outliers are (0; 1,156.375).
The component that is outlier is California.
Explanation of Solution
Calculation:
Step by step procedure to obtain boxplot using MINITAB software is given as,
- Choose Graph > Boxplot.
- In Graph variables enter the columns Membership.
- Click OK.
In the boxplot, the outlier is represented using asterisk. In the boxplot of data set there is one asterisk representing outliers. Hence, there is one outlier in the dataset.
Limits for detecting outliers:
Any data value beyond the below points are considered as outliers.
Substitute,
Since the membership cannot be negative, the lower point is considered as 0.
The points below 0 and above 1,156.375 are considered as outliers. Hence the limits for outliers are (0; 1,156.375).
The membership corresponding to state ‘California’ is 1,165, which is above the upper limit 1,156.375. This shows that, California is a component of outlier.
Hence, the component that is outlier is California.
Want to see more full solutions like this?
Chapter 4 Solutions
EBK STATISTICAL TECHNIQUES IN BUSINESS


 Glencoe Algebra 1, Student Edition, 9780079039897...AlgebraISBN:9780079039897Author:CarterPublisher:McGraw Hill