
Survey of Accounting (Accounting I)
8th Edition
ISBN: 9781305961883
Author: Carl Warren
Publisher: Cengage Learning
expand_more
expand_more
format_list_bulleted
Videos
Textbook Question
Chapter 4, Problem 4.7.3MBA
Gross profit percent and markup percent
Deere & Company (DE) produces and sells tractors, loaders, combines, lawnmowers, and a variety of other equipment. The following data (in millions) were adapted from recent financial statements of Deere.
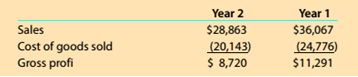
Compare the results in parts (1) and (2) for ‘tears 1 and 2. Comment on your comparison.
Expert Solution & Answer
Want to see the full answer?
Check out a sample textbook solution
Students have asked these similar questions
Revenue and expense data for Young Technologies Inc. are as follows:
Year 2
Year 1
Sales
$500,000
$440,000
Cost of goods sold
325,000
242,000
Selling expense
70,000
79,200
Administrative expenses
75,000
70,400
Income tax expense
10,500
16,400
Required:
Question Content Area
a. Prepare an income statement in comparative form, stating each item for both years as an amount and as a percent of sales. Round percentage amounts to nearest whole percent.
Young Technologies Inc.Comparative Income StatementFor the Years Ended December 31, Year 2 and Year 1
Year 2 Amount
Year 2 Percent
Year 1 Amount
Year 1 Percent
$- Select -
- Select -%
$- Select -
- Select -%
- Select -
- Select -%
- Select -
- Select -%
$- Select -
- Select -%
$- Select -
- Select -%
- Select -
- Select -%
- Select -
- Select -%
- Select -
- Select -%
- Select -
- Select -%
Total expenses
$fill in the blank 3bd7f90c1fc4f97_26
fill in…
Revenue and expense data for Young Technologies Inc. are as follows:
Year 2
Year 1
Sales
$500,000
$440,000
Cost of goods sold
325,000
242,000
Selling expense
70,000
79,200
Administrative expenses
75,000
70,400
Income tax expense
10,500
16,400
Required:
a. Prepare an income statement in comparative form, stating each item for both years as an amount and as a percent of sales. Round percentage amounts to nearest whole percent.
Young Technologies Inc.
Comparative Income Statement
For the Years Ended December 31, Year 2 and Year 1
Year 2 Amount
Year 2 Percent
Year 1 Amount
Year 1 Percent
fill in the blank
fill in the blank
$fill in the blank
fill in the blank
fill in the blank
fill in the blank
fill in the blank
fill in the blank
$fill in the blank
fill in the blank
$fill in the blank
fill in the blank
fill in the blank
fill in the blank
fill in the blank
fill in the blank
fill in the blank…
Revenue and expense data for Young Technologies Inc. are as follows:
Year 2
Year 1
Sales
$500,000
$440,000
Cost of goods sold
325,000
242,000
Selling expense
70,000
79,200
Administrative expenses
75,000
70,400
Income tax expense
10,500
16,400
Required:
a. Prepare an income statement in comparative form, stating each item for both years as an amount and as a percent of sales. Round percentage amounts to nearest whole percent.
Young Technologies Inc.
Comparative Income Statement
For the Years Ended December 31, Year 2 and Year 1
Year 2 Amount
Year 2 Percent
Year 1 Amount
Year 1 Percent
$fill in the blank 0b884b011fe8068_2
fill in the blank 0b884b011fe8068_3%
$fill in the blank 0b884b011fe8068_4
fill in the blank 0b884b011fe8068_5%
fill in the blank 0b884b011fe8068_7
fill in the blank 0b884b011fe8068_8%
fill in the blank 0b884b011fe8068_9
fill in the blank 0b884b011fe8068_10%
$fill in the blank…
Chapter 4 Solutions
Survey of Accounting (Accounting I)
Ch. 4 - If merchandise purchased on account is returned,...Ch. 4 - Prob. 2SEQCh. 4 - Prob. 3SEQCh. 4 - On a multiple-step income statement, the excess of...Ch. 4 - As of December 31, 20Y4, Ames Corporation's...Ch. 4 - What distinguishes a retail business from a...Ch. 4 - Prob. 2CDQCh. 4 - Prob. 3CDQCh. 4 - Prob. 4CDQCh. 4 - Prob. 5CDQ
Ch. 4 - When you purchase a new car, the “sticker price”...Ch. 4 - Prob. 7CDQCh. 4 - Differentiate between the multiple and single-step...Ch. 4 - Prob. 9CDQCh. 4 - Can a business earn a gross profit but incur a net...Ch. 4 - Prob. 11CDQCh. 4 - Prob. 12CDQCh. 4 - Determining gross profit During the current year,...Ch. 4 - Determining cost of goods sold For a recent year,...Ch. 4 - Purchase-related transaction Burr Company...Ch. 4 - Purchase-related transactions A retailer Is...Ch. 4 - Prob. 4.5ECh. 4 - Prob. 4.6ECh. 4 - Determining amounts to be paid on invoices...Ch. 4 - Prob. 4.8ECh. 4 - Sales-related transactions After the amount due on...Ch. 4 - Sales-related transactions Merchandise is sold on...Ch. 4 - Prob. 4.11ECh. 4 - Prob. 4.12ECh. 4 - Prob. 4.13ECh. 4 - Prob. 4.14ECh. 4 - Adjustment for merchandise inventory shrinkage...Ch. 4 - Adjustment for Customer Refunds and Returns Assume...Ch. 4 - Prob. 4.17ECh. 4 - Multiple-step income statement On March 31, 20Y5,...Ch. 4 - Single-step income statement Summary operating...Ch. 4 - Multiple-step income statement Identify the enurs...Ch. 4 - Purchase-related transactions The following...Ch. 4 - Sales-related transactions The- following selected...Ch. 4 - Prob. 4.3PCh. 4 - Multiple-step income statement and report form of...Ch. 4 - Multiple-step income statement and report form of...Ch. 4 - Multiple-step income statement and report form of...Ch. 4 - Multiple-step income statement and report form of...Ch. 4 - Single-step income statement Selected accounts and...Ch. 4 - Prob. 4.5.2PCh. 4 - Prob. 4.6.1PCh. 4 - Prob. 4.6.2PCh. 4 - Prob. 4.1MBACh. 4 - Sales transactions Using transactions listed in...Ch. 4 - Prob. 4.3MBACh. 4 - Prob. 4.4MBACh. 4 - Prob. 4.5.1MBACh. 4 - Gross margin percent and markup percent Target...Ch. 4 - Gross margin percent and markup percent Target...Ch. 4 - Prob. 4.6MBACh. 4 - Gross profit percent and markup percent Deere &...Ch. 4 - Prob. 4.7.2MBACh. 4 - Gross profit percent and markup percent Deere &...Ch. 4 - Gross profit percent and markup percent...Ch. 4 - Gross profit percent and markup percent...Ch. 4 - Gross profit percent and markup percent...Ch. 4 - Prob. 4.9MBACh. 4 - Prob. 4.10.1MBACh. 4 - Gross profit percent and markup percent Companies...Ch. 4 - Prob. 4.10.3MBACh. 4 - Prob. 4.1CCh. 4 - Prob. 4.2CCh. 4 - Prob. 4.3.1CCh. 4 - Determining cost of purchase The following is an...Ch. 4 - Prob. 4.4.1CCh. 4 - Prob. 4.4.2CCh. 4 - Prob. 4.4.3CCh. 4 - Prob. 4.5C
Knowledge Booster


Learn more about
Need a deep-dive on the concept behind this application? Look no further. Learn more about this topic, accounting and related others by exploring similar questions and additional content below.Similar questions
- Gross profit percent and markup percent Caterpillar Inc. (CAT) produces and sells various types of equipment. including tractors, loaders, and mining equipment. The following data (in millions) were adapted from recent financial statements of Caterpillar. Compute the average markup percent for Years 1 and 2. Round to one decimal place.arrow_forwardGross profit percent and markup percent Deere & Company (DE) produces and sells tractors, loaders, combines, lawnmowers, and a variety of other equipment. The following data (in millions) were adapted from recent financial statements of Deere. Compute the gross profit percent for Years 1 and 2. Round to one decimal place.arrow_forwardGross profit percent and markup percent Caterpillar Inc. (CAT) produces and sells various types of equipment, including tractors, loaders, and mining equipment. The following data (in millions) were adapted from recent financial statements of Caterpillar. Compare the results in parts (1) and (2) for Years 1 and 2. Comment on your comparison.arrow_forward
- Return on assets The following data (in millions) were adapted from recent financial statements of Tootsie Roll Industries Inc. (TR): The percent a company adds to its cost of sales to determine selling price is called a markup. What is Tootsie Roll’s markup percent? Round to one decimal place.arrow_forwardRevenue and expense data for Young Technologies are as follows: Year 2 Year 1 Sales $500,000 $440,000 Cost of goods sold 325,000 242,000 Selling expense 70,000 79,200 Administrative expenses 75,000 70,400 Income tax expense 10,500 16,400 Prepare an income statement in comparative form, stating each item for both years as an amount and as a percent of sales. Round to the nearest whole percent. Comment on the significant changes disclosed by the comparative income statement.arrow_forwardRevenue and expense data for Innovation Quarter Inc. for two recent years are as follows: Current Year Previous Year Sales $ 2,720,000 $2,050,000 Cost of goods sold 1,675,520 1,111,100 Selling expenses 320,960 319,800 Administrative expenses 424,320 262,400 Income tax expense 152,320 118,900 A. Prepare an income statement in comparative form, stating each item for both years as a percent of sales. Round your percentages answers to one decimal place. Enter all amounts as positive numbers. B. Comment on the significant changes disclosed by the comparative income statement.arrow_forward
- Revenue and expense data for Young Technologies Inc. are as follows: Year 2 Year 1 Sales $500,000 $440,000 Cost of merchandise sold 325,000 242,000 Selling expenses 70,000 79,200 Administrative expenses 75,000 70,400 Income tax expense 10,500 16,400 Required: Question Content Area a. Prepare an income statement in comparative form, stating each item for both years as an amount and as a percent of sales. Round percentage amounts to nearest whole percent. Young Technologies Inc.Comparative Income StatementFor the Years Ended December 31, Year 2 and Year 1 Year 2 Amount Year 2 Percent Year 1 Amount Year 1 Percent $- Select - - Select -% $- Select - - Select -% - Select - - Select - - Select - - Select - $- Select - - Select -% $- Select - - Select -% $- Select - - Select -% $- Select - - Select -% - Select - - Select - - Select - - Select - Total expenses $fill in the blank 86d00500602205c_26 fill in the…arrow_forwardComparative Income StatementsConsider the following income statement data from the Ross Company: Current Year Previous Year Sales revenue $525,000 $450,000 Cost of goods sold 336,000 279,000 Selling expenses 105,000 99,000 Administrative expenses 60,000 54,000 Income tax expense 7,800 5,400 Prepare a comparative income statement, showing increases and decreases in dollars and in percentages. Note: Round "Percent Change" answers to one decimal place (ex: 0.2345 = 23.5%). ROSS COMPANYComparative Income Statements Current Year Previous Year Increase(Decrease) PercentChange Sales Revenue Answer Answer Answer Answer Cost of Goods Sold Answer Answer Answer Answer Answer Answer Answer Answer Answer Answer Selling Expenses Answer Answer Answer Answer Administrative Expenses Answer Answer Answer Answer Total Answer Answer Answer Answer Income before Income Taxes Answer Answer Answer Answer Answer Answer Answer Answer Answer Answer…arrow_forwardVertical analysis income statement Revenue expense data for Innovation quarter Inc for two recent years as follows. Sales Cost of goods. Selling expenses Administrative expenses Income tax expense Current year. 4,000,000 2,280,000 600,000 520,000 240,000 Previous year 3,600,000 1,872,000 648,000 360,000 216,000 A. Prepare an income statement in comparative form, stating to each item for both of years as a percent of sales. Round to the nearest whole percentage. Innovation quarter Inc comparative income tax for the years ended December 31st Sales Cost of goods Selling expenses Administrative expenses Income tax expense $ % $ % $ % $ % $ % $ % $ % $ % B. The vertical analysis indicates that the cost of the goods sold as a percent of sales by 5 percentage points, while selling expenses by 3% percentage and administrative expenses by 3% percentage points. Thus net income as…arrow_forward
- Profitability Analysis Erin Enterprises reports the following information on its year-end income statement: Net Sales $200,000 Operating Expenses $40,000 Cost of Goods Sold 110,000 Other Income 25,000 Required Calculate Erin’s gross profit percentage and return on sales ratio.(Round answer to one decimal place.) Gross profit percentage = Answer Return on sales ratio = Answerarrow_forwardRevenue and expense data for Innovation Quarter Inc. for two recent years are as follows: Current Year Previous Year Sales $ 2,920,000 $2,150,000 Cost of goods sold 1,769,520 1,182,500 Selling expenses 332,880 322,500 Administrative expenses 449,680 279,500 Income tax expense 169,360 116,100 A. Prepare an income statement in comparative form, stating each item for both years as a percent of sales. Round your percentages answers to one decimal place. Enter all amounts as positive numbers. B. Comment on the significant changes disclosed by the comparative income statement. Innovation Quarter Inc. Comparative Income Statement For the Years Ended December 31 1 Current year Current year Previous year Previous year 2 Amount Percent Amount Percent 3 Sales $2,920,000.00 $2,150,000.00 4 Cost of goods sold 1,769,520.00 1,182,500.00 5 Gross profit $1,150,480.00…arrow_forwardRevenue and expense data for Young Technologies Inc. are as follows: Year 2 Year 1 Sales $500,000 $440,000 Cost of goods sold 325,000 242,000 Selling expenses 70,000 79,200 Administrative expenses 75,000 70,400 Income tax expense 10,500 16,400 Required: (a) Prepare an income statement in comparative form, stating each item for both years as an amount and as a percent of sales. Round your percentages answers to one decimal place. Enter all amounts as positive numbers. (b) Comment on the significant changes disclosed by the comparative income statement. Prepare an income statement in comparative form, stating each item for both years as an amount and as a percent of sales. Round your percentages answers to one decimal place. Enter all amounts as positive numbers. Young Technologies Inc. Comparative Income Statement For the Years Ended December 31, Year 2 and Year 1 1 Year 2 Year 2 Year 1 Year 1…arrow_forward
arrow_back_ios
SEE MORE QUESTIONS
arrow_forward_ios
Recommended textbooks for you
 Survey of Accounting (Accounting I)AccountingISBN:9781305961883Author:Carl WarrenPublisher:Cengage Learning
Survey of Accounting (Accounting I)
Accounting
ISBN:9781305961883
Author:Carl Warren
Publisher:Cengage Learning
Markup and Markdown; Author: GreggU;https://www.youtube.com/watch?v=EFtodgI46UM;License: Standard Youtube License