
Videos
The Bloomberg web site included the data in the accompanying table on the number of movies made by 25 Saturday Night Live cast members as of 2014 (bloomberg.com/graphics/best-and-worst /#top-grossing-saturday-night-live-alumni, retrieved April 20, 2017). Also given was the top grossing movie made by each and the gross income for that movie adjusted for inflation.
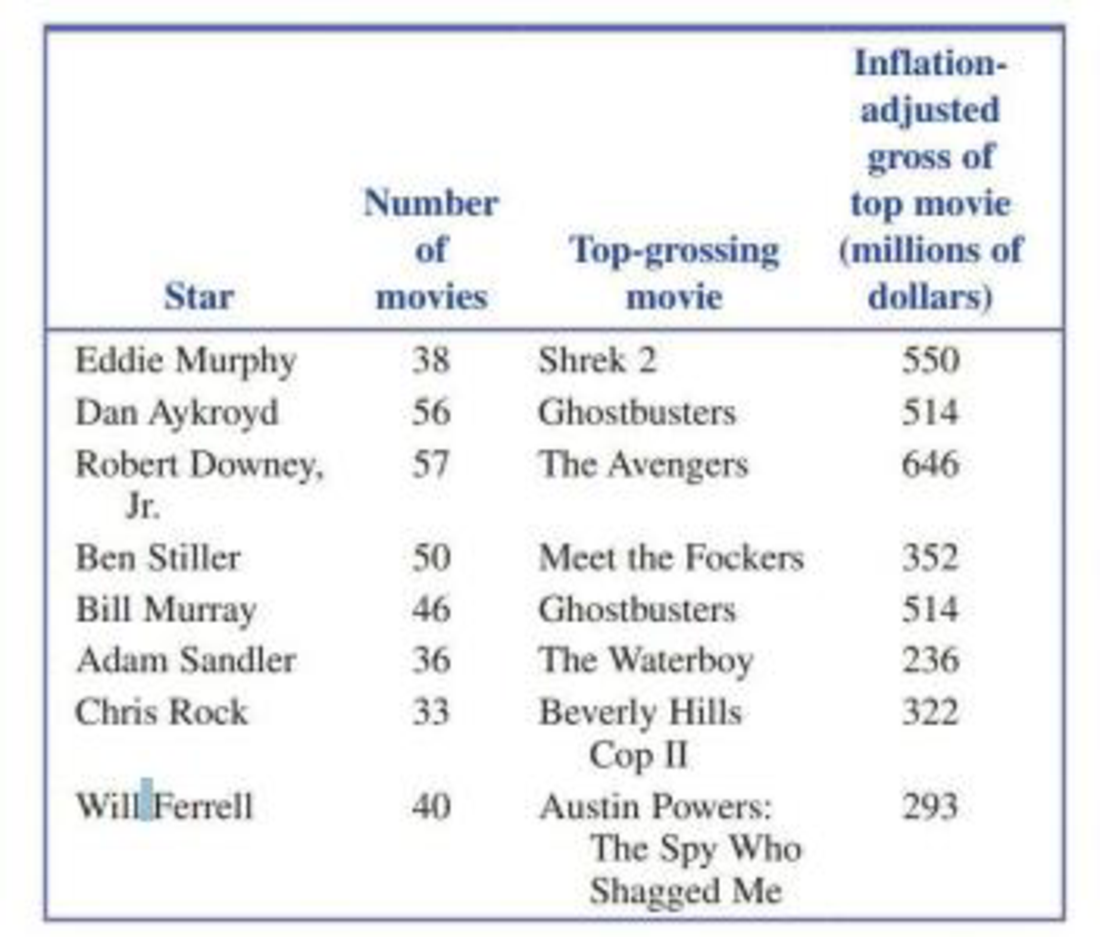
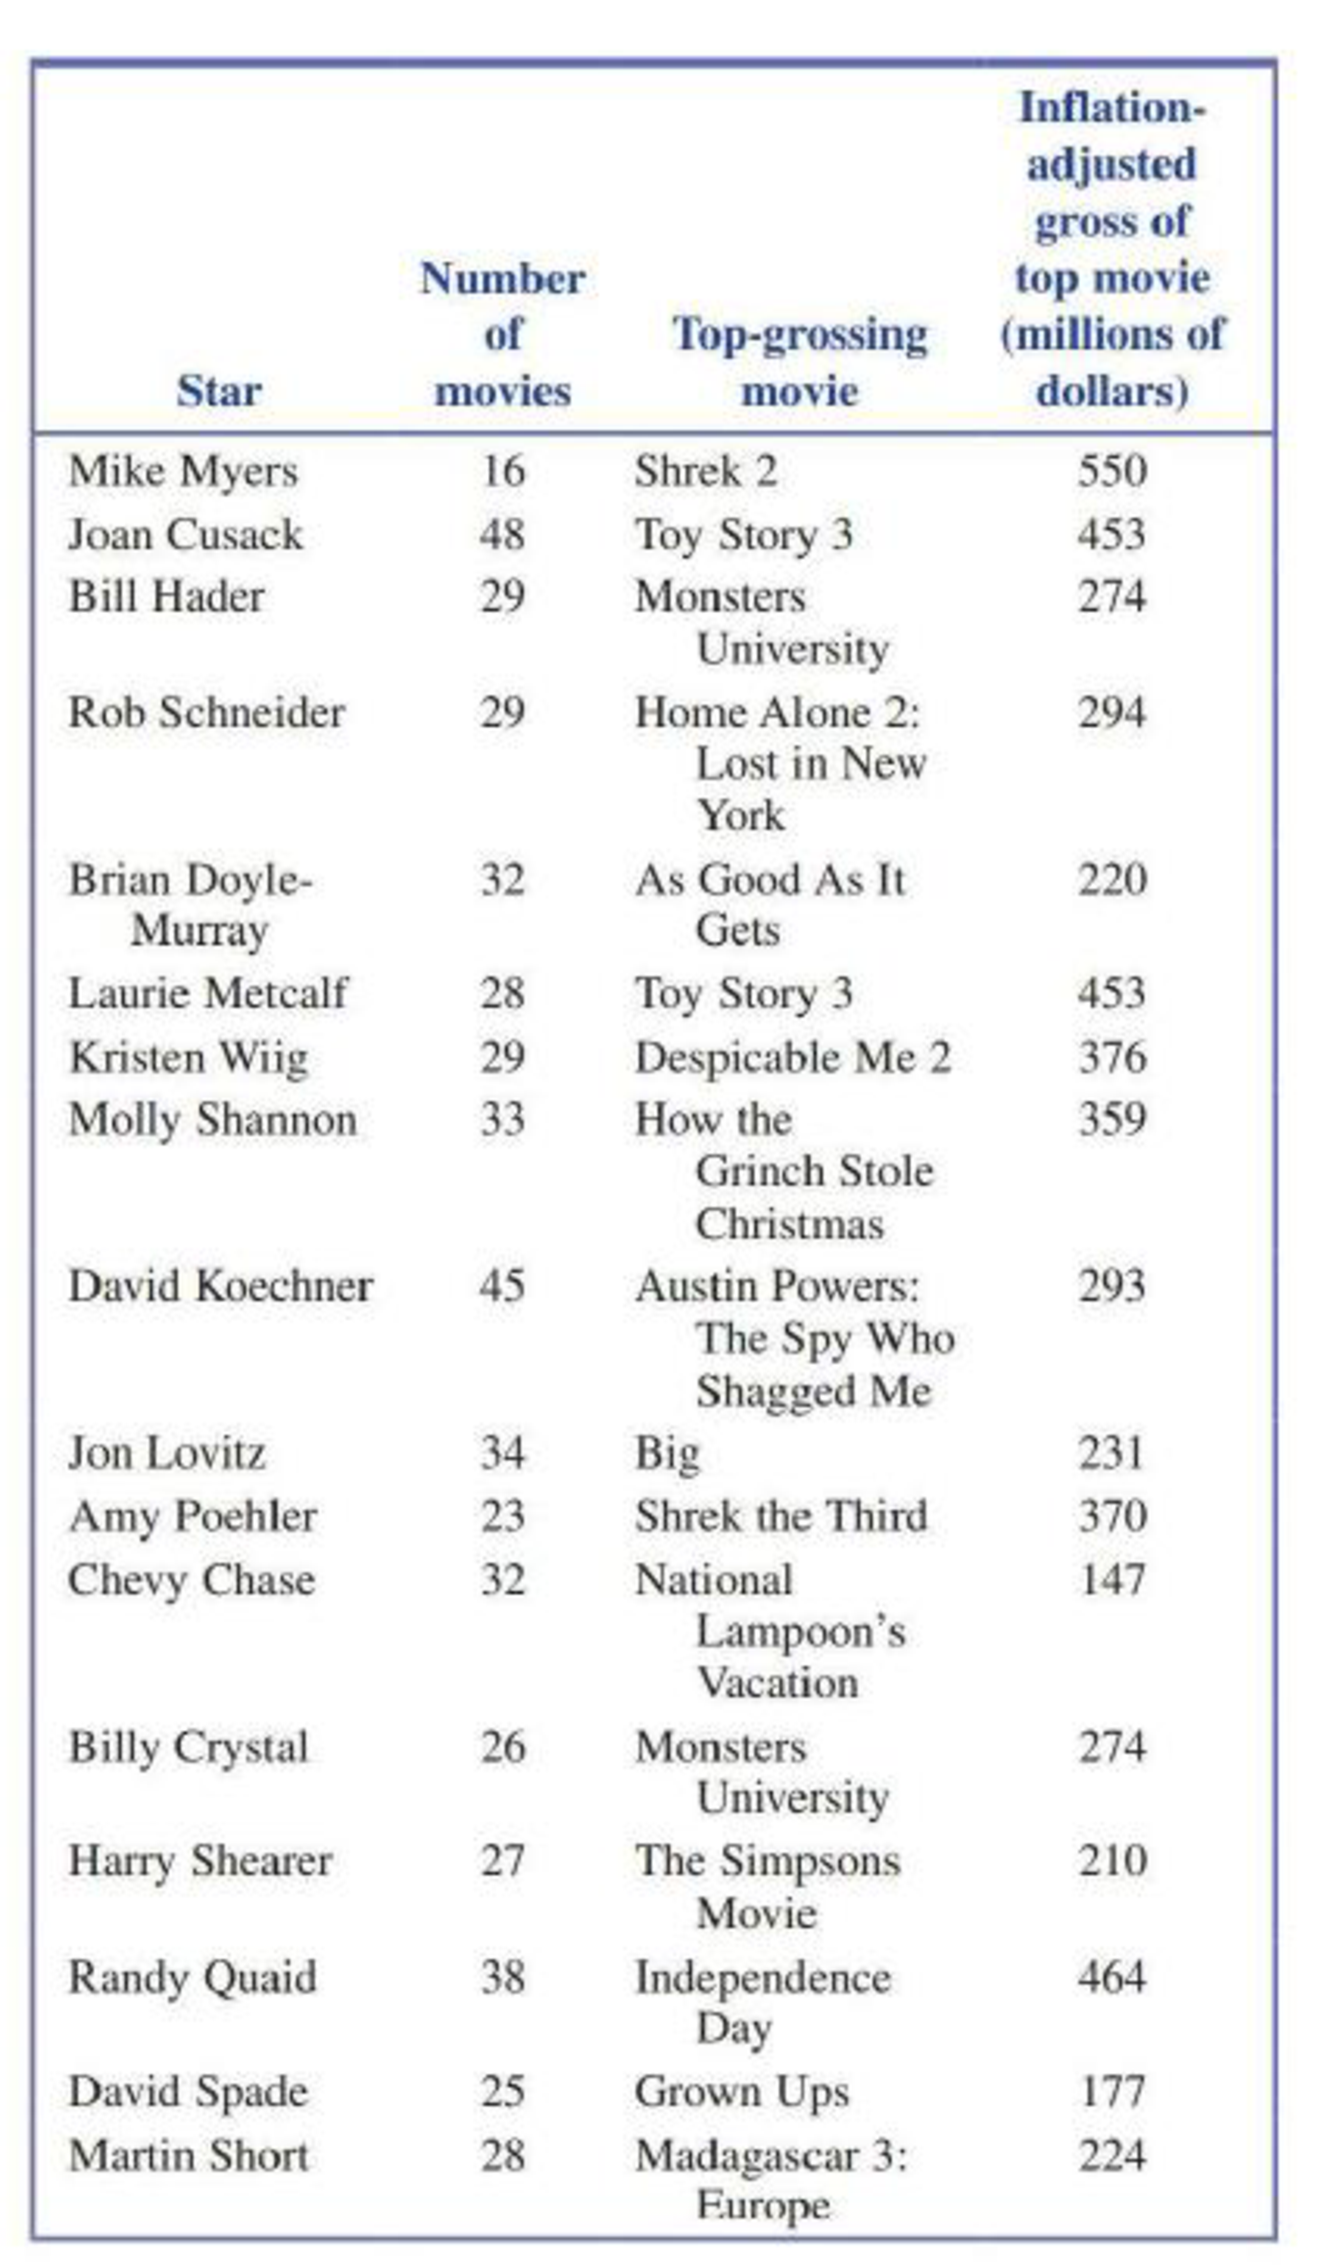
Construct a boxplot for the number of movies data and comment on what the boxplot tells you about the distribution of the number of movies data.

Trending nowThis is a popular solution!

Chapter 4 Solutions
Introduction To Statistics And Data Analysis
Additional Math Textbook Solutions
Elementary Statistics (13th Edition)
Introductory Statistics (2nd Edition)
PRACTICE OF STATISTICS F/AP EXAM
Research Methods for the Behavioral Sciences (MindTap Course List)
Stats: Modeling the World Nasta Edition Grades 9-12
Statistics for Business and Economics (13th Edition)


 Glencoe Algebra 1, Student Edition, 9780079039897...AlgebraISBN:9780079039897Author:CarterPublisher:McGraw Hill
 Big Ideas Math A Bridge To Success Algebra 1: Stu...AlgebraISBN:9781680331141Author:HOUGHTON MIFFLIN HARCOURTPublisher:Houghton Mifflin Harcourt
 Holt Mcdougal Larson Pre-algebra: Student Edition...AlgebraISBN:9780547587776Author:HOLT MCDOUGALPublisher:HOLT MCDOUGAL
 College Algebra (MindTap Course List)AlgebraISBN:9781305652231Author:R. David Gustafson, Jeff HughesPublisher:Cengage Learning
 Algebra: Structure And Method, Book 1AlgebraISBN:9780395977224Author:Richard G. Brown, Mary P. Dolciani, Robert H. Sorgenfrey, William L. ColePublisher:McDougal Littell