
Videos
Conducting a Financial Ratio Analysis on HP INC.
Use online resources to work on this chapter's questions. Please note that website information changes over time, and these changes may limit your ability to answer some of these questions.
In Chapter 3, we looked at Dunkin' Brands' financial statements. In this chapter, we will use financial Internet websites (specifically, www.morningstar.com and www.google.com / finance) to analyze HP Inc., a computer hardware company. Once on either website, you simply enter HP Inc.'s ticker symbol (HPQ) to obtain the financial information needed.
The text mentions that financial statement analysis has two major components: a trend analysis, where we evaluate changes in key ratios over time, and a freer analysis, where we compare financial ratios with firms that are in the same industry and/or line of business. We will do both of these types of analysis in this problem.
Through the Morningstar website, you can find the firm's financials (Income Statement, Balance Sheet, and Cash Flow) on an annual or quarterly basis for the five most recent time periods. In addition, the site contains Key Ratios (Profitability, Growth, Cash Flow, Financial Health, and Efficiency) for 10 years. We will use the Key Ratios on this site to conduct the firm's trend analysis. (At the bottom of the screen you will see that you can click "Glossary” to find definitions for the different ratios For example, Morningstar's Financial Leverage ratio is the same as the Equity multiplier that we use in the textbook.)
On the Google Finance site, you can find the firm’s financial statements for the four most recent years or the five most recent quarters and key financial data for related companies for the most recent year or quarter. We will use the related companies' annual data to conduct the firm's peer analysis. Notice that when you go to the "Related Companies" screen, you can "add or remove columns." Click on that phrase, and you can check which peer data items you'd like to show on tire computer screen. Also, once you have chosen the data, you can click on a term, and the companies will be ranked in either ascending or descending order for tire specific term selected.
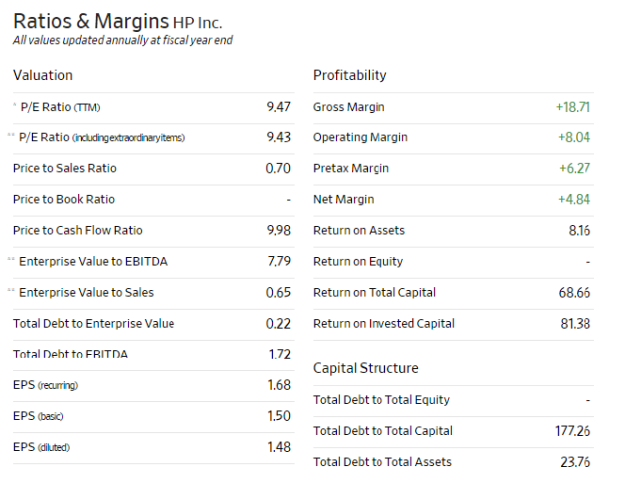
6. From the Google Finance site, look at HP's profitability ratios (as measured by its profit margin,
Want to see the full answer?
Check out a sample textbook solution
Chapter 4 Solutions
Fundamentals of Financial Management (MindTap Course List)


- Conducting a Financial Ratio Analysis on HP INC. Use online resources to work on this chapter's questions. Please note that website information changes over time, and these changes may limit your ability to answer some of these questions. In Chapter 3, we looked at Dunkin' Brands' financial statements. In this chapter, we will use financial Internet websites (specifically, www.morningstar.com and www.google.com/finance) to analyze HP Inc., a computer hardware company. Once on either website, you simply enter HP Inc.'s ticker symbol (HPQ) to obtain the financial information needed. The text mentions that financial statement analysis has two major components: a trend analysis, where we evaluate changes in key ratios over time, and a freer analysis, where we compare financial ratios with firms that are in the same industry and/or line of business. We will do both of these types of analysis in this problem. Through the Morningstar website, you can find the firm's financials (Income Statement, Balance Sheet, and Cash Flow) on an annual or quarterly basis for the five most recent time periods. In addition, the site contains Key Ratios (Profitability, Growth, Cash Flow, Financial Health, and Efficiency) for 10 years. We will use the Key Ratios on this site to conduct the firm's trend analysis. (At the bottom of the screen you will see that you can click "Glossary" to find definitions for the different ratios. For example, Morningstar's Financial Leverage ratio is the same as the Equity multiplier that we use in the textbook.) On the Google Finance site, you can find the firms financial statements for the four most recent years or the five most recent quarters and key financial data for related companies for the most recent year or quarter. We will use the related companies' annual data to conduct the firm's peer analysis. Notice that when you go to the "Related Companies" screen, you can "add or remove columns." Click on that phrase, and you can check which peer data items you'd like to show on tire computer screen. Also, once you have chosen the data, you can click on a term, and the companies will be ranked in either ascending or descending order for the specific term selected. 1. Looking at Morningstar's Financial Health ratios, what has happened to HPs liquidity position over the past 10 years?arrow_forwardConducting a Financial Ratio Analysis on HP INC. Use online resources to work on this chapter's questions. Please note that website information changes over time, and these changes may limit your ability to answer some of these questions. In Chapter 3, we looked at Dunkin' Brands' financial statements. In this chapter, we will use financial Internet websites (specifically, www.morningstar.com and wnvcv.google.com/finance) to analyze HP Inc., a computer hardware company. Once on either website, you simply enter HP Inc.'s ticker symbol (HPQ) to obtain the financial information needed. The text mentions that financial statement analysis has two major components: a trend analysis, where we evaluate changes in key ratios over time, and a peer analysis, where we compare financial ratios with firms that are in the same industry and/or line of business. We will do both of these types of analysis in this problem. Through the Morningstar website, you can find the firm's financials (Income Statement, Balance Sheet, and Cash Flow) on an annual or quarterly basis for the five most recent time periods. In addition, the site contains Key Ratios (Profitability, Growth, Cash Flow, Financial Health, and Efficiency) for 10 years. We will use the Key Ratios on this site to conduct the firm's trend analysis. (At the bottom of the screen you will see that you can click "Glossary to find definitions for the different ratios For example, Morningstar's Financial Leverage ratio is the same as the Equity multiplier that we use in the textbook.) On the Google Finance site, you can find the firms financial statements for the four most recent years or the five most recent quarters and key financial data for related companies for the most recent year or quarter. We will use the related companies' annual data to conduct the firms peer analysis. Notice that when you go to the "Related Companies" screen, you can add or remove columns. Click on that phrase, and you can check which peer data items you'd like to show on tire computer screen. Also, once you have chosen the data, you can click on a term, and the companies will be ranked in either ascending or descending order for the specific term selected. 7. From the Google Finance site, use the DuPont analysis to determine the total assets turnover ratio for each of tire peer companies. (Hint ROA = Profit margin Total assets turnover.) Once you've calculated each peer 's total assets turnover ratio, then you can use the DuPont analysis to calculate each peer's equity multiplier.arrow_forwardConducting a Financial Ratio Analysis on HP INC. Use online resources to work on this chapter's questions. Please note that website information changes over time, and these changes may limit your ability to answer some of these questions. In Chapter 3, we looked at Dunkin' Brands' financial statements. In this chapter, we will use financial Internet websites (specifically, www.morningstar.com and www.google.com/finance) to analyze HP Inc., a computer hardware company. Once on either website, you simply enter HP Inc.'s ticker symbol (HPQ) to obtain the financial information needed. The text mentions that financial statement analysis has two major components: a trend analysis, where we evaluate changes in key ratios over time, and a freer analysis, where we compare financial ratios with firms that are in the same industry and/or line of business. We will do both of these types of analysis in this problem. Through the Morningstar website, you can find the firm's financials (Income Statement, Balance Sheet, and Cash Flow) on an annual or quarterly basis for the five most recent time periods. In addition, the site contains Key Ratios (Profitability, Growth, Cash Flow, Financial Health, and Efficiency) for 10 years. We will use the Key Ratios on this site to conduct the firm's trend analysis. (At the bottom of the screen you will see that you can click "Glossary" to find definitions for the different ratios. For example, Morningstar's Financial Leverage ratio is the same as the Equity multiplier that we use in the textbook.) On the Google Finance site, you can find the firms financial statements for the four most recent years or the five most recent quarters and key financial data for related companies for the most recent year or quarter. We will use the related companies' annual data to conduct the firm's peer analysis. Notice that when you go to the "Related Companies" screen, you can "add or remove columns." Click on that phrase, and you can check which peer data items you'd like to show on tire computer screen. Also, once you have chosen the data, you can click on a term, and the companies will be ranked in either ascending or descending order for tire specific term selected. 2. Looking at Morningstar's Financial Health ratios, what has happened to HP's financial leverage position over tire past 10 years?arrow_forward
- Conducting a Financial Ratio Analysis on HP INC. Use online resources to work on this chapter's questions. Please note that website information changes over time, and these changes may limit your ability to answer some of these questions. In Chapter 3, we looked at Dunkin' Brands' financial statements. In this chapter, we will use financial Internet websites (specifically, www.morningstar.com and www.google.com/finance) to analyze HP Inc., a computer hardware company. Once on either website, you simply enter HP Inc.'s ticker symbol (HPQ) to obtain the financial information needed. The text mentions that financial statement analysis has two major components: a trend analysis, where we evaluate changes in key ratios over time, and a peer analysis, where we compare financial ratios with firms that are in the same industry and/or line of business. We will do both of these types of analysis in this problem. Through the Morningstar website, you can find the firm's financials (Income Statement, Balance Sheet, and Cash Flow) on an annual or quarterly basis for the five most recent time periods. In addition, the site contains Key Ratios (Profitability, Growth, Cash Flow, Financial Health, and Efficiency) for 10 years. We will use the Key Ratios on this site to conduct the firm's trend analysis. (At the bottom of the screen you will see that you can click "Glossary" to find definitions for the different ratios. For example, Morningstar's Financial Leverage ratio is the same as the Equity multiplier that we use in the textbook.) On the Google Finance site, you can find the firms financial statements for the four most recent years or the five most recent quarters and key financial data for related companies for the most recent year or quarter. We will use the related companies' annual data to conduct the firm's peer analysis. Notice that when you go to the "Related Companies" screen, you can "add or remove columns." Click on that phrase, and you can check which peer data items you'd like to show on tire computer screen. Also, once you have chosen the data, you can click on a term, and the companies will be ranked in either ascending or descending order for tire specific term selected. 5. From the Google Finance site, look at HP's liquidity position (as measured by its current ratio). How does this ratio compare with those of its peers?arrow_forwardConducting a Financial Ratio Analysis on HP INC. Use online resources to work on this chapter's questions. Please note that website information changes over time, and these changes may limit your ability to answer some of these questions. In Chapter 3, we looked at Dunkin' Brands' financial statements. In this chapter, we will use financial Internet websites (specifically, www.morningstar.com and www.google.com / finance) to analyze HP Inc., a computer hardware company. Once on either website, you simply enter HP Inc.'s ticker symbol (HPQ) to obtain the financial information needed. The text mentions that financial statement analysis has two major components: a trend analysis, where we evaluate changes in key ratios over time, and a peer analysis, where we compare financial ratios with firms that are in the same industry and/or line of business. We will do both of these types of analysis in this problem. Through the Morningstar website, you can find the firm's financials (Income Statement, Balance Sheet, and Cash Flow) on an annual or quarterly basis for the five most recent time periods. In addition, the site contains Key Ratios (Profitability, Growth, Cash Flow, Financial Health, and Efficiency) for 10 years. We will use the Key Ratios on this site to conduct the firm's trend analysis. (At the bottom of the screen you will see that you can click "Glossary" to find definitions for the different ratios. For example, Morningstar's Financial Leverage ratio is the same as the Equity multiplier that we use in the textbook.) On the Google Finance site, you can find the firms financial statements for the four most recent years or the five most recent quarters and key financial data for related companies for the most recent year or quarter. We will use the related companies' annual data to conduct the firm's peer analysis. Notice that when you go to the "Related Companies" screen, you can "add or remove columns." Click on that phrase, and you can check which peer data items you'd like to show on tire computer screen. Also, once you have chosen the data, you can click on a term, and the companies will be ranked in either ascending or descending order for the specific term selected. 4. Identify Google Finance's list of related companies to HP. Which is the largest in terms of market capitalization? Which is the smallest? Where does HT rank (in terms of market capitalization)?arrow_forwardWho will be a user of financial statements, and what will they be used for? Question 17 options: Lenders will use financial statements to decide whether to invest in a company. Investors will use financial statements to decide whether to lend money to a company. The marketing department is interested in the operating income figures in the financial statements. Managers will use financial statements to make decisions about their company.arrow_forward
- The following is a list of well-known companies: 1. Alcoa Inc. 2. Boeing 3. Caterpillar 4. Citigroup Inc. 5. CVS 6. Delta Air Lines 7. eBay Inc. 8. FedEx 9. Ford Motor Company 10. Gap Inc. 11. HR Block 12. Hilton Hospitality, Inc. 13. Procter Gamble 14. SunTrust 15. Wal-Mart Stores, Inc. a. Indicate whether each of these companies is primarily a service, merchandise, or manufacturing business. If you are unfamiliar with the company, use the Internet to locate the companys home page or use the finance website of Yahoo (finance.yahoo.com). b. For which of the preceding companies is the accounting equation relevant?arrow_forwardUse the internet to research one manufacturing, one retail (or merchandising), and one service business. For each business, describe the following: A. the primary purpose of the entity B. the types of activities that accountants would record (hint: what is the source of the business funding, and what costs might the business have?) C. the types of decisions that might be made in this organization and how financial and nonfinancial information might help the decision-making processarrow_forwardWhy Does It Matter? ECOTOUR EXPEDITIONS, INC., Jamestown, Rhode Island You probably have never imagined the possibility of being an accountant who could have a direct impact on improving global ecosystems. Accountants who work for Ecotour Expeditions, Inc., an ecotourism company, might manage accounting details for guest air travel and accommodations, tour guide compensation, expedition revenue, and a variety of expenses. What type of accounting transactions would Ecotour Expeditions have? List 3 to 4 transactions and then record the journal entry for each transaction. Example: Purchase safari jeep with cash, 42,500. Safari Jeep42,500 Cash42,500arrow_forward
 Fundamentals of Financial Management (MindTap Cou...FinanceISBN:9781285867977Author:Eugene F. Brigham, Joel F. HoustonPublisher:Cengage Learning
 Fundamentals of Financial Management (MindTap Cou...FinanceISBN:9781337395250Author:Eugene F. Brigham, Joel F. HoustonPublisher:Cengage Learning
 Fundamentals of Financial Management, Concise Edi...FinanceISBN:9781305635937Author:Eugene F. Brigham, Joel F. HoustonPublisher:Cengage Learning
 Financial Accounting: The Impact on Decision Make...AccountingISBN:9781305654174Author:Gary A. Porter, Curtis L. NortonPublisher:Cengage Learning
 Financial And Managerial AccountingAccountingISBN:9781337902663Author:WARREN, Carl S.Publisher:Cengage Learning,
 Financial AccountingAccountingISBN:9781337272124Author:Carl Warren, James M. Reeve, Jonathan DuchacPublisher:Cengage Learning