
Concept explainers
Videos
(a)
The scatter plot, whether the provided values of
(a)
Answer to Problem 23P
Solution: The provided values, that is,
Explanation of Solution
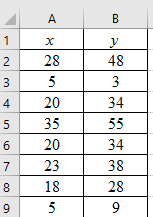
Given: The provided table consists of values of x and y, where x represents the average annual hours spent by a person in traffic delay, y represents the average annual gallons of fuel wasted per person due to traffic delay. The data consists of 8 data pairs, thus n is 8.
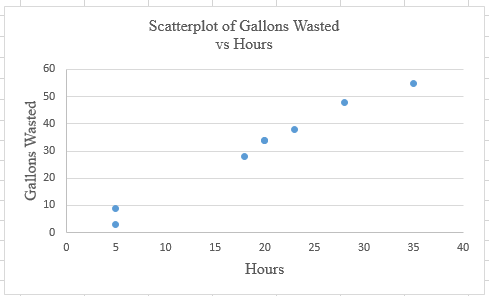
Calculation: Follow the steps given below in MS Excel to obtain the scatter plot of the data.
Step 1: Enter the data into an MS Excel sheet. The screenshot is given below.
Step 2: Select the data and click on ‘Insert’. Go to charts and select the chart type ‘Scatter’.

Step 3: Select the first plot and then click ‘add chart element’ provided in the left corner of the menu bar. Insert the ‘Axis titles’ and ‘Chart title’. The scatter plot for the provided data is shown below:
To calculate
| 28 | 48 | 784 | 2304 | 1344 |
| 5 | 3 | 25 | 9 | 15 |
| 20 | 34 | 400 | 1156 | 680 |
| 35 | 55 | 1225 | 3025 | 1925 |
| 20 | 34 | 400 | 1156 | 680 |
| 23 | 38 | 529 | 1444 | 874 |
| 18 | 28 | 324 | 784 | 504 |
| 5 | 9 | 25 | 81 | 45 |
The provided values,
Now, the value of
Substituting the values in the above formula. Thus:
Therefore, the correlation coefficient is 0.991.
(b)
The averages
(b)
Answer to Problem 23P
Solution: The values for data set 1 are
The values for data set 2 are
Explanation of Solution
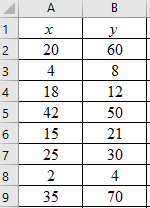
Given: The provided table consists of values of x and y, where x represents the average annual hours spent by a person in traffic delay, y represents the average annual gallons of fuel wasted per person due to traffic delay.
The second table consists of x and y values where, x represent the annual hours lost by a person spent in traffic delay, y represents the annual gallons of fuel wasted by that person in traffic delay.
The data sets consist of 8 data pairs, thus n is 8 for both the data sets.
The provided values of data set 1 are,
The provided values of data set 2 are,
Calculation:
The value of
The value of
The standard deviation of x for data set 1 can be calculated as,
The standard deviation of
The value of
The value of
The standard deviation of
The standard deviation of
For the second data set, that is, for the variables based on single individuals, the standard deviations
The values
(c)
The scatter plot, whether the provided values of
(c)
Answer to Problem 23P
Solution: The provided values, that is,
Explanation of Solution
The provided table consists of values of x and y, where x represents the average annual hours spent by a person in traffic delay, y represents the average annual gallons of fuel wasted per person due to traffic delay.
The data sets consist of 8 data pairs, thus n is 8.
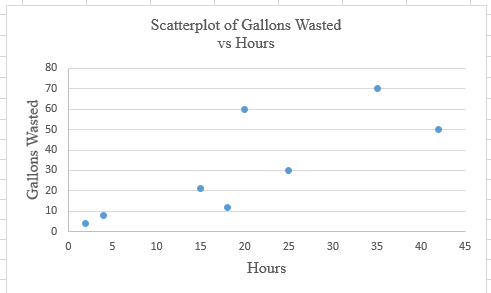
Calculation: Follow the steps given below in MS Excel to obtain the scatter plot of the data.
Step 1: Enter the data into an MS Excel sheet. The screenshot is given below.
Step 2: Select the data and click on ‘Insert’. Go to charts and select the chart type ‘Scatter’.
Step 3: Select the first plot and then click ‘add chart element’ provided in the left corner of the menu bar. Insert the ‘Axis titles’ and ‘Chart title’. The scatter plot for the provided data is shown below:
Calculation: The calculation for
| 20 | 60 | 400 | 3600 | 1200 |
| 4 | 8 | 16 | 64 | 32 |
| 18 | 12 | 324 | 144 | 216 |
| 42 | 50 | 1764 | 2500 | 2100 |
| 15 | 21 | 225 | 441 | 315 |
| 25 | 30 | 625 | 900 | 750 |
| 2 | 4 | 4 | 16 | 8 |
| 35 | 70 | 1225 | 4900 | 2450 |
The provided values,
Now, the value of
Substituting the values in the above formula. Thus:
Therefore, the correlation coefficient is 0.794.
(d)
Comparison between the values of r that are calculated in part (a) and part (c), whether the data for average have a higher correlation coefficient than the data for individual measurement or not, and the reason for it.
(d)
Answer to Problem 23P
Solution: Yes, the data for average has a higher correlation coefficient than the data for individual measurement because, according to the central limit theorem, the standard deviation of averages will be smaller than the standard deviation of individual values.
Explanation of Solution
Given: The values of correlation coefficient from part (a) and part (b) are 0.991 and 0.794, respectively.
It can be seen that
According to the central limit theorem, the standard deviation is smaller for the
Want to see more full solutions like this?
Chapter 4 Solutions
Understanding Basic Statistics


 Glencoe Algebra 1, Student Edition, 9780079039897...AlgebraISBN:9780079039897Author:CarterPublisher:McGraw Hill
 Big Ideas Math A Bridge To Success Algebra 1: Stu...AlgebraISBN:9781680331141Author:HOUGHTON MIFFLIN HARCOURTPublisher:Houghton Mifflin Harcourt