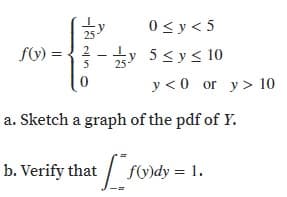
0 < y < 5 fV) = { ? - +y 5 10 a. Sketch a graph of the pdf of Y. b. Verify that fy)dy = 1.


Continuous Probability Distributions
Probability distributions are of two types, which are continuous probability distributions and discrete probability distributions. A continuous probability distribution contains an infinite number of values. For example, if time is infinite: you could count from 0 to a trillion seconds, billion seconds, so on indefinitely. A discrete probability distribution consists of only a countable set of possible values.
Normal Distribution
Suppose we had to design a bathroom weighing scale, how would we decide what should be the range of the weighing machine? Would we take the highest recorded human weight in history and use that as the upper limit for our weighing scale? This may not be a great idea as the sensitivity of the scale would get reduced if the range is too large. At the same time, if we keep the upper limit too low, it may not be usable for a large percentage of the population!
In commuting to work, a professor must first get on a bus near her house and then transfer to a second bus. If the waiting time (in minutes) at each stop has a uniform distribution with A = 0 and B = 5, then it can be shown that the total waiting time Y has the
Refer the image
c. What is the
d. What is the probability that total waiting time is at most 8 min?
e. What is the probability that total waiting time is between 3 and 8 min?
f. What is the probability that total waiting time is either less than 2 min or more than 6 min?


Trending now
This is a popular solution!

Step by step
Solved in 4 steps with 1 images


