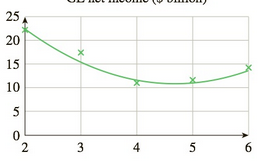
GE Net Income 2007–2011 The annual net income of General Electric for the period 2007–2011 could be 8 approximated by P ( t ) = 1.6 t 2 − 15 t + 46 billion dollars ( 2 ≤ t ≤ 6 ) , Where t is time in year since 2005. GE net income ($ billions) a. Compute P ' ( t ) . How fast was GE’s annual net income changing in 2008? (Be careful to give correct units of measurement.) b. According to the model, GE’s annual net income (A) increased at a faster and faster rate (B) increased at a slower and slower rate (C) decreased at a faster and faster rate (D) decreased at a slower and slower rate during the first 2 years shown (the interval [ 2 , 4 ] ). Justify your answer in two ways: geometrically, reasoning entirely from the graph, and algebraically, reasoning from the derivative of P . [ HINT: See Example 4.]
GE Net Income 2007–2011 The annual net income of General Electric for the period 2007–2011 could be 8 approximated by P ( t ) = 1.6 t 2 − 15 t + 46 billion dollars ( 2 ≤ t ≤ 6 ) , Where t is time in year since 2005. GE net income ($ billions) a. Compute P ' ( t ) . How fast was GE’s annual net income changing in 2008? (Be careful to give correct units of measurement.) b. According to the model, GE’s annual net income (A) increased at a faster and faster rate (B) increased at a slower and slower rate (C) decreased at a faster and faster rate (D) decreased at a slower and slower rate during the first 2 years shown (the interval [ 2 , 4 ] ). Justify your answer in two ways: geometrically, reasoning entirely from the graph, and algebraically, reasoning from the derivative of P . [ HINT: See Example 4.]
GE Net Income 2007–2011 The annual net income of General Electric for the period 2007–2011 could be 8 approximated by
P
(
t
)
=
1.6
t
2
−
15
t
+
46 billion dollars
(
2
≤
t
≤
6
)
,
Where t is time in year since 2005.
GE net income ($ billions)
a. Compute
P
'
(
t
)
. How fast was GE’s annual net income changing in 2008? (Be careful to give correct units of measurement.)
b. According to the model, GE’s annual net income
(A) increased at a faster and faster rate
(B) increased at a slower and slower rate
(C) decreased at a faster and faster rate
(D) decreased at a slower and slower rate during the first 2 years shown (the interval
[
2
,
4
]
). Justify your answer in two ways: geometrically, reasoning entirely from the graph, and algebraically, reasoning from the derivative of P. [HINT: See Example 4.]
Need a deep-dive on the concept behind this application? Look no further. Learn more about this topic, calculus and related others by exploring similar questions and additional content below.
01 - What Is A Differential Equation in Calculus? Learn to Solve Ordinary Differential Equations.; Author: Math and Science;https://www.youtube.com/watch?v=K80YEHQpx9g;License: Standard YouTube License, CC-BY
Higher Order Differential Equation with constant coefficient (GATE) (Part 1) l GATE 2018; Author: GATE Lectures by Dishank;https://www.youtube.com/watch?v=ODxP7BbqAjA;License: Standard YouTube License, CC-BY


 Algebra & Trigonometry with Analytic GeometryAlgebraISBN:9781133382119Author:SwokowskiPublisher:Cengage
 Trigonometry (MindTap Course List)TrigonometryISBN:9781337278461Author:Ron LarsonPublisher:Cengage Learning
 College AlgebraAlgebraISBN:9781305115545Author:James Stewart, Lothar Redlin, Saleem WatsonPublisher:Cengage Learning
 Glencoe Algebra 1, Student Edition, 9780079039897...AlgebraISBN:9780079039897Author:CarterPublisher:McGraw Hill