
Introduction To Statistics And Data Analysis
6th Edition
ISBN: 9781337793612
Author: PECK, Roxy.
Publisher: Cengage Learning,
expand_more
expand_more
format_list_bulleted
Concept explainers
Videos
Textbook Question
Chapter 4.3, Problem 37E
The U.S. Department of Health and Human Services reported the estimated percentage of U.S. households with only wireless phone service (no landline) in 2014 for the 50 states and the District of Columbia (cdc.gov/nchs/data/nhis/earlyrelease/wireless_state_201602.
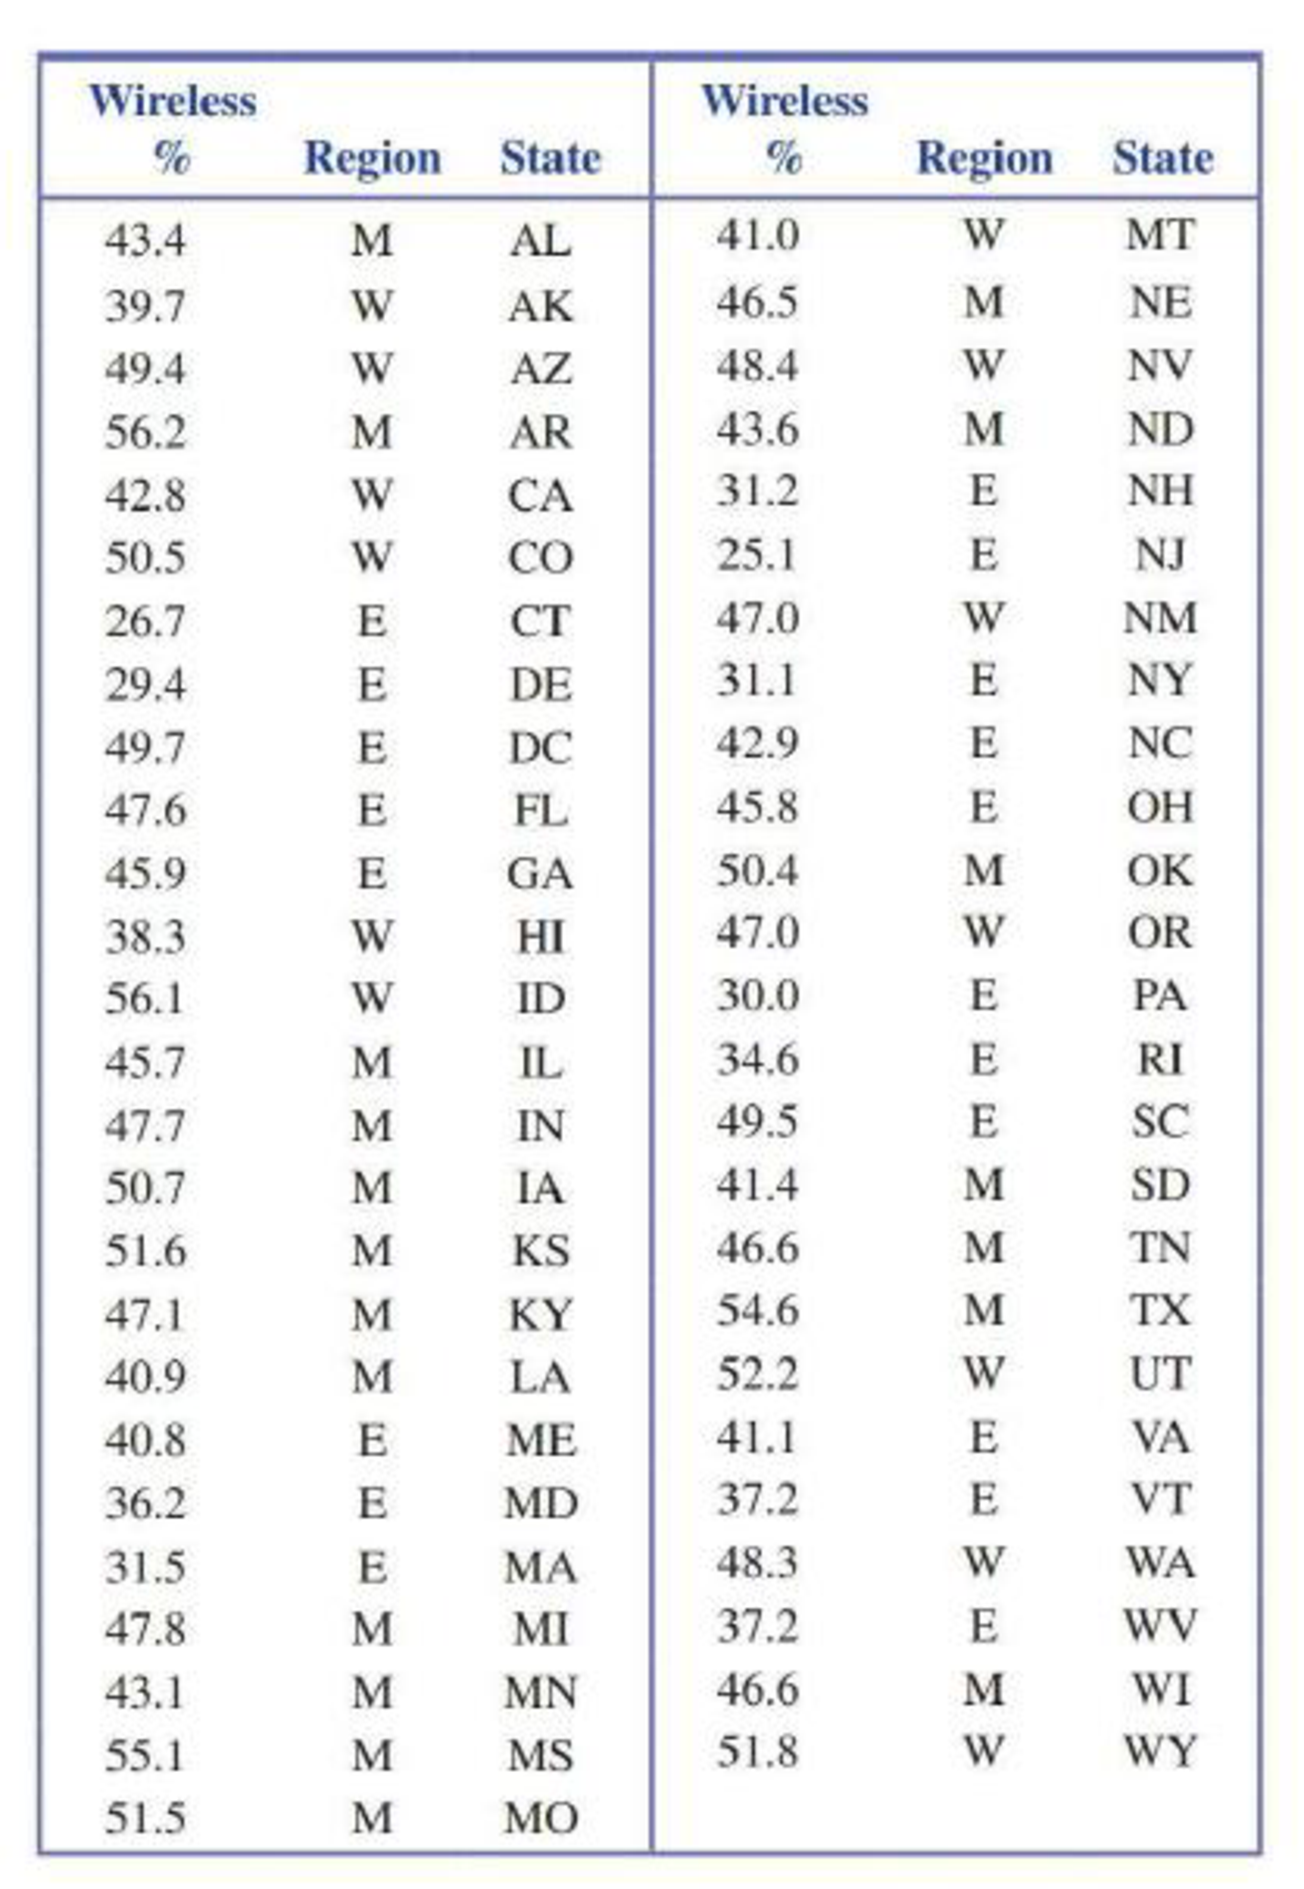
- a. Construct a comparative boxplot that makes it possible to compare wireless percent for the three geographical regions.
- b. Does the graphical display in Part (a) reveal any striking differences, or are the distributions similar for the three regions?
Expert Solution & Answer
Want to see the full answer?
Check out a sample textbook solution
Students have asked these similar questions
The National Center for Education Statistics reported that 47% of college students work to pay for tuition and living expenses. Assume that a sample of 450 college students was used in the study.
According to the February 2008 Federal Trade Commission report on consumer fraud and identity theft, 23% of all complaints in 2007 were for identity theft. In that year, assume some state had 454 complaints of identity theft out of 1660 consumer complaints. Do these data provide enough evidence to show that the state had a higher proportion of identity theft than 23%? Test at the 10% level.
The Consumer Financial Protection Bureau's Consumer Response Team hears directly from consumers about the challenges they face in the marketplace , brings their concerns to the attention of financial institutions , and assists in addressing their complaints . Of the consumers who registered a bank account and service com plaint , 46 % cited " account management , " complaints related to the marketing or management of an account , as their complaint . Source : Consumer Response Annual Report , bit.ly/2x4CN5w . Consider a sample of 20 consumers who registered bank account and service complaints . Use the binomial model to answer the fol lowing questions : a . What is the expected value , or mean , of the binomial distribution ? b . What is the standard deviation of the binomial distribution ? c . What is the probability that 10 of the 20 consumers cited " account management " as the type of complaint ? d . What is the probability that no more than 5 of the consumers cited " account…
Chapter 4 Solutions
Introduction To Statistics And Data Analysis
Ch. 4.1 - The following are the prices (in dollars) of the...Ch. 4.1 - The article Caffeine Content of Drinks...Ch. 4.1 - Consumer Reports Health...Ch. 4.1 - Consumer Reports Health...Ch. 4.1 - The article The Wedding Industrys Pricey Little...Ch. 4.1 - The state of California defines family income...Ch. 4.1 - The report State of the News Media 2015 (Pew...Ch. 4.1 - Each student in a sample of 20 seniors at a...Ch. 4.1 - The U.S. Department of Transportation reported the...Ch. 4.1 - The ministry of Health and Long-Term Care in...
Ch. 4.1 - Houses in California are expensive, especially on...Ch. 4.1 - Consider the following statement: More than 65% of...Ch. 4.1 - A sample consisting of four pieces of luggage was...Ch. 4.1 - Suppose that 10 patients with meningitis received...Ch. 4.1 - A study of the lifetime (in hours) for a certain...Ch. 4.1 - An instructor has graded 19 exam papers submitted...Ch. 4.2 - The following data are costs (in cents) per ounce...Ch. 4.2 - Cost per serving (in cents) for six high-fiber...Ch. 4.2 - Combining the cost-per-serving data for high-fiber...Ch. 4.2 - Prob. 20ECh. 4.2 - The accompanying data are consistent with summary...Ch. 4.2 - The paper referenced in the previous exercise also...Ch. 4.2 - The price (in dollars) of the eight smart phones...Ch. 4.2 - In addition to the prices of the highly rated...Ch. 4.2 - In an experiment to assess the effect of listening...Ch. 4.2 - The paper referenced in the previous exercise also...Ch. 4.2 - The accompanying data on number of minutes used...Ch. 4.2 - Give two sets of five numbers that have the same...Ch. 4.2 - Morningstar is an investment research from that...Ch. 4.2 - The U.S. Department of Transportation reported the...Ch. 4.2 - The Ministry of Health and Long-Term Care in...Ch. 4.2 - In 1997, a woman sued a computer keyboard...Ch. 4.2 - The standard deviation alone does not measure...Ch. 4.3 - Based on a large national sample of working...Ch. 4.3 - The report Most Licensed Drivers Age 85+: States...Ch. 4.3 - Data on the gasoline tax per gallon (in cents) in...Ch. 4.3 - The U.S. Department of Health and Human Services...Ch. 4.3 - Fiber content (in grns per serving) for 18 high...Ch. 4.3 - In addition to the fiber contents given in the...Ch. 4.3 - Use the fiber content and sugar content data given...Ch. 4.3 - The article The Bestand WorstPlaces to be a...Ch. 4.4 - The average playing time of music albums in a...Ch. 4.4 - In a study investigating the effect of car speed...Ch. 4.4 - The U.S. Census Bureau (2000 census) reported the...Ch. 4.4 - For the travel time distribution given in the...Ch. 4.4 - Use the information given in the previous two...Ch. 4.4 - Mobile homes are tightly constructed for energy...Ch. 4.4 - The article Impact of Berkeley Excise Tax on...Ch. 4.4 - A student took two national aptitude tests. The...Ch. 4.4 - Suppose that your younger sister is applying for...Ch. 4.4 - The report Who Borrows Most? Bachelors Degree...Ch. 4.4 - The paper Study of the Flying Ability of...Ch. 4.4 - Suppose that the manufacturer of a scale claims...Ch. 4.4 - Suppose that your statistics professor returned...Ch. 4.4 - The paper Answer Changing in Multiple Choice...Ch. 4.4 - Suppose that the average reading speed of students...Ch. 4.4 - The following data values are 2014 per capita...Ch. 4.4 - The accompanying table gives the mean and standard...Ch. 4.5 - The authors of the paper Delayed Time to...Ch. 4.5 - The paper Portable Social Groups: Willingness to...Ch. 4 - Acrylamide (a possible cancer-causing substance)...Ch. 4 - Prob. 62CRCh. 4 - Because some homes have selling prices that are...Ch. 4 - Although bats are not known for their eyesight,...Ch. 4 - For the data in the previous exercise, subtract 10...Ch. 4 - For the data of Exercise 4.64, multiply each data...Ch. 4 - The Bloomberg web site included the data in the...Ch. 4 - Refer to the data given in the previous exercise....Ch. 4 - Age at diagnosis for each of 20 patients under...Ch. 4 - Suppose that the distribution of scores on an exam...
Additional Math Textbook Solutions
Find more solutions based on key concepts
How much time do Americans living in or near cities spend waiting in traffic, and how much does waiting in traf...
Business Statistics: A First Course (7th Edition)
In a test of the quality of two television commercials, each commercial was shown in a separate test area six t...
Statistics for Business & Economics, Revised (MindTap Course List)
In Exercises 9-20, use the data in the following table, which lists drive-thru order accuracy at popular fast f...
Elementary Statistics (13th Edition)
(a) For each data set, find the mean, median, and mode. (b) Discuss anything about the data that affects the us...
APPLIED STAT.IN BUS.+ECONOMICS
Teacher Salaries
The following data from several years ago represent salaries (in dollars) from a school distri...
Elementary Statistics: A Step By Step Approach
Empirical versus Theoretical A Monopoly player claims that the probability of getting a 4 when rolling a six-si...
Introductory Statistics (2nd Edition)
Knowledge Booster


Learn more about
Need a deep-dive on the concept behind this application? Look no further. Learn more about this topic, statistics and related others by exploring similar questions and additional content below.Similar questions
- According to Nielsen Inc., the top 20 rated TV shows for 2018, based on the share of the total available audience, are listed here. A researcher believes that viewing habits of viewers who live in the U.S. Pacific Standard Time (PST) zone are not related to the Nielsen shares. The researcher surveyed a random sample of TV viewers in the PST zone and computed a composite ranking for the top 20 TV shows. Nielsen Rank Show Network Share PST ZoneComposite Rank 1 NFL Sunday Night Football NBC 6.2 1 2 This Is Us NBC 5.4 3 3 Roseanne ABC 5 12 4 NFL Thursday Night Football (CBS + NFLN) CBS 4.5 5 5 The Big Bang Theory CBS 4.4 11 6 NFL Sunday Night Football Pre-Kickoff NBC 4.3 14 7 NFL Thursday Night Football (NBC + NFLN) NBC 4 19 8 The OT Fox 3.8 16 9 The Good Doctor ABC 3.4 7 10 Young Sheldon CBS 3.3 6 11 Grey's Anatomy ABC 3.2 13 12 Football Night in America 3 NBC 3.1 8 13 9-1-1 Fox 3 2 14 Will & Grace NBC 2.8 9 15 Empire Fox 2.6 20 16 The Voice NBC 2.5…arrow_forwardAccording to Nielsen Inc., the top 20 rated TV shows for 2018, based on the share of the total available audience, are listed here. A researcher believes that viewing habits of viewers who live in the U.S. Pacific Standard Time (PST) zone are not related to the Nielsen shares. The researcher surveyed a random sample of TV viewers in the PST zone and computed a composite ranking for the top 20 TV shows. Nielsen Rank Show Network Share PST ZoneComposite Rank 1 NFL Sunday Night Football NBC 6.2 1 2 This Is Us NBC 5.4 3 3 Roseanne ABC 5 12 4 NFL Thursday Night Football (CBS + NFLN) CBS 4.5 5 5 The Big Bang Theory CBS 4.4 11 6 NFL Sunday Night Football Pre-Kickoff NBC 4.3 14 7 NFL Thursday Night Football (NBC + NFLN) NBC 4 19 8 The OT Fox 3.8 16 9 The Good Doctor ABC 3.4 7 10 Young Sheldon CBS 3.3 6 11 Grey's Anatomy ABC 3.2 13 12 Football Night in America 3 NBC 3.1 8 13 9-1-1 Fox 3 2 14 Will & Grace NBC 2.8 9 15 Empire Fox 2.6 20 16 The Voice NBC 2.5…arrow_forwardAccording to Nielsen Inc., the top 20 rated TV shows for 2018, based on the share of the total available audience, are listed here. A researcher believes that viewing habits of viewers who live in the U.S. Pacific Standard Time (PST) zone are not related to the Nielsen shares. The researcher surveyed a random sample of TV viewers in the PST zone and computed a composite ranking for the top 20 TV shows. Nielsen Rank Show Network Share PST ZoneComposite Rank 1 NFL Sunday Night Football NBC 6.2 1 2 This Is Us NBC 5.4 3 3 Roseanne ABC 5 12 4 NFL Thursday Night Football (CBS + NFLN) CBS 4.5 5 5 The Big Bang Theory CBS 4.4 11 6 NFL Sunday Night Football Pre-Kickoff NBC 4.3 14 7 NFL Thursday Night Football (NBC + NFLN) NBC 4 19 8 The OT Fox 3.8 16 9 The Good Doctor ABC 3.4 7 10 Young Sheldon CBS 3.3 6 11 Grey's Anatomy ABC 3.2 13 12 Football Night in America 3 NBC 3.1 8 13 9-1-1 Fox 3 2 14 Will & Grace NBC 2.8 9 15 Empire Fox 2.6 20 16 The Voice NBC 2.5…arrow_forward
- According to the February 2008 Federal Trade Commission report on consumer fraud and identity theft, 23% of all complaints in 2007 were for identity theft. In that year, Alaska had 321 complaints of identity theft out of 1,432 consumer complaints ("Consumer fraud and," 2008). Does this data provide enough evidence to show that Alaska had a lower proportion of identity theft than 23%? Test at the 5% level.arrow_forwardAn article reported the estimated percentage of U.S. households with only wireless phone service (no landline) for the 50 states and the District of Columbia. In the accompanying data table, each state was also classified into one of three geographical regions—West (W), Middle states (M), and East (E). Wireless % Region State Wireless % Region State 43.4 M AL 40.9 W MT 39.6 W AK 46.6 M NE 49.3 W AZ 48.5 W NV 56.2 M AR 43.5 M ND 42.9 W CA 31.2 E NH 50.5 W CO 25.2 E NJ 26.8 E CT 46.9 W NM 29.4 E DE 31.1 E NY 49.7 E DC 42.8 E NC 47.7 E FL 45.8 E OH 45.9 E GA 50.5 M OK 38.4 W HI 47.1 W OR 56.1 W ID 30.0 E PA 45.8 M IL 34.7 E RI 47.6 M IN 49.6 E SC 50.8 M IA 41.4 M SD 51.5 M KA 46.6 M TN 47.1 M KY 54.6 M TX 40.8 M LA 52.1 W UT 40.7 E ME 41.0 E VA 36.1 E MD 37.1 E VT 31.5 E MA 48.4 W WA 47.7 M MI 37.2 E WV 43.0 M MN 46.5 M WI 55.1 M MS 51.8 W WY 51.6 M MO (a) Construct a comparative boxplot that makes it possible to compare…arrow_forwardThe Hate Crime Statistics Act of 1990 requires the Attorney General to collect national data about crimes that manifest evidence of prejudice based on race, religion, sexualorientation, or ethnicity, including the crimes of murder and non-negligent manslaughter,forcible rape, aggravated assault, simple assault, intimidation, arson, and destruction, dam-age, or vandalism of property. The Hate Crime Data collected in 2005 reveals, based on arandomly selected sample of 500 incidents, that the mean number of victims in a particulartype of hate crime was 2.65, with a standard deviation of 1.22. Assuming that the numberof victims wasnormally distributed, answer the following questions. a) What proportion of crime incidents had more than three victims? b) What is the probability that there was more than one victim in an incident? c) What proportion of crime incidents had less than four victims? d) Construct and interpret an estimate of the population at the 95% level.arrow_forward
- Write down a dataset of size n = 10 such that the 5-number summary is: 1,4,10,12,15arrow_forwardSurgery was performed on 492 patients in theAnywhere Health Care Facility during March, and 27 ofthose patients died within 10 days of surgery. FindPostoperative death rate.arrow_forwardThe Los Angeles City Controller's office calculated that in 2013, the city employed 4703047030 full‑time employees and 1014210142 part‑time employees. Assume that an outside advocacy group had been lobbying the Mayor's office to convert part‑time workers into full‑time workers throughout 2014. The Controller's office makes its calculations annually. Suppose that the outside advocacy group wanted to know the proportion of city employees (excluding per‑event employees) who are full‑time employees ?p in June 2014 to gauge if their lobbying efforts had been effective. Suppose that the group surveyed a random sample of 1000 city employees (excluding per‑event employees) in June 2014 and found that 845845 were full‑time employees and 155155 were part‑time employees. If the advocacy group planned to use a one‑sample z-z-test for a proportion to test their lobbying eforts, the appropriate null hypothesis would be and the appropriate alternative hypothesis would be Assume…arrow_forward
- 6 Interpret the following cluster analysis data collected by people thinking of starting a nonprofit organization.arrow_forward“The US Centers for Disease Control and Prevention said about 72 million Americans—nearly one out of every four of the country’s 304 million residents—are considered obese. Millions more are designated as overweight.” The American trend toward obesity has prompted many physicians to offer weight-loss programs to their patients. [Source: Price, W. T. “Physicians Get into the Weight-Loss Business.” Florida Today, July 7, 2008.] A physician conducted an experimental study to compare the effectiveness of four different weight-loss programs. In the study, 64 obese adults were randomly assigned to the four programs so that each program had 16 adults. The programs lasted for six months. The weights of the subjects were measured before and after the programs, and each subject’s weight loss was computed in pounds. The following table summarizes the results of the study, giving the number of observations and the sample mean and variance of the subjects’ weight loss in each program.…arrow_forward
arrow_back_ios
arrow_forward_ios
Recommended textbooks for you
 Holt Mcdougal Larson Pre-algebra: Student Edition...AlgebraISBN:9780547587776Author:HOLT MCDOUGALPublisher:HOLT MCDOUGAL
 Glencoe Algebra 1, Student Edition, 9780079039897...AlgebraISBN:9780079039897Author:CarterPublisher:McGraw Hill
Holt Mcdougal Larson Pre-algebra: Student Edition...
Algebra
ISBN:9780547587776
Author:HOLT MCDOUGAL
Publisher:HOLT MCDOUGAL
Glencoe Algebra 1, Student Edition, 9780079039897...
Algebra
ISBN:9780079039897
Author:Carter
Publisher:McGraw Hill
Hypothesis Testing - Solving Problems With Proportions; Author: The Organic Chemistry Tutor;https://www.youtube.com/watch?v=76VruarGn2Q;License: Standard YouTube License, CC-BY
Hypothesis Testing and Confidence Intervals (FRM Part 1 – Book 2 – Chapter 5); Author: Analystprep;https://www.youtube.com/watch?v=vth3yZIUlGQ;License: Standard YouTube License, CC-BY