
Fundamentals of Statistics (5th Edition)
5th Edition
ISBN: 9780134510026
Author: Sullivan
Publisher: PEARSON
expand_more
expand_more
format_list_bulleted
Concept explainers
Videos
Textbook Question
Chapter 4.3, Problem 6AYU
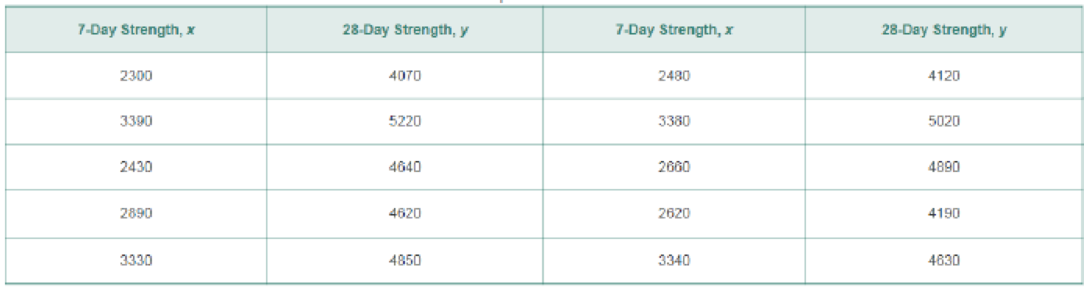
Concrete As concrete cures, it gains strength. The following data represent the 7-day and 28-day strength (in pounds per square inch) of a certain type of concrete. The coefficient of determination is 57.5%. Provide an interpretation of this value.
Expert Solution & Answer
Want to see the full answer?
Check out a sample textbook solution
Students have asked these similar questions
Hookworms are parasitic nematodes that live in the intestines of a host. Hookworms do their damage (often fatally) by draining blood
from the intestinal wall. The data below correlate the number of hookworms and the amount of blood lost by that number of worms.
(Include units below if applicable. If necessary, use a separate sheet of paper for 6c and 7c.)
Number of hookworms (x)
Blood lost per day (y)
24
12.2 mL
5
2.48 cm3
45
1.37 in3
88
1.49 oz
80
39.8 cm3
63
31.5 mL
1) Inspect the data and estimate the amount of blood lost due to one hookworm. (mL/day)
Find the percentile that corresponds to a specific data value x by using the following formula.
number of data values less than x
100
Percentile ofx%3D
total number of data values
The ages (in years) and heights (in inches) of all pitchers for a baseball team are listed. Find the coefficient of variation for each of the two data sets. Then compare the results.
E Click the icon to view the data sets.
C/neights = % (Round to one decimal place as needed.)
Chapter 4 Solutions
Fundamentals of Statistics (5th Edition)
Ch. 4.1 - What is the difference between univariate data and...Ch. 4.1 - The _____ variable is the variable whose value can...Ch. 4.1 - A _____ _____ is a graph that shows the relation...Ch. 4.1 - What does it mean to say two variables are...Ch. 4.1 - If r = _____, then a perfect negative linear...Ch. 4.1 - True or False: If the linear correlation...Ch. 4.1 - A _____ variable is a variable that is related to...Ch. 4.1 - True or False: Correlation implies causation.Ch. 4.1 - In Problems 912, determine whether the scatter...Ch. 4.1 - In Problems 912, determine whether the scatter...
Ch. 4.1 - In Problems 912, determine whether the scatter...Ch. 4.1 - In Problems 912, determine whether the scatter...Ch. 4.1 - NW Match the linear correlation coefficient to the...Ch. 4.1 - Match the linear correlation coefficient to the...Ch. 4.1 - Prob. 15AYUCh. 4.1 - Relation between Education and Birthrate? The...Ch. 4.1 - In Problems 1720, (a) draw a scatter diagram of...Ch. 4.1 - In Problems 1720, (a) draw a scatter diagram of...Ch. 4.1 - In Problems 1720, (a) draw a scatter diagram of...Ch. 4.1 - In Problems 1720, (a) draw a scatter diagram of...Ch. 4.1 - Name the Relation, Part I For each of the...Ch. 4.1 - Prob. 22AYUCh. 4.1 - The TIMMS Exam The Trends in International...Ch. 4.1 - Prob. 24AYUCh. 4.1 - NW An Unhealthy Commute The Gallup Organization...Ch. 4.1 - Credit Scores Your Fair Isaacs Corporation (FICO)...Ch. 4.1 - Height versus Head Circumference A pediatrician...Ch. 4.1 - American Black Bears The American black bear...Ch. 4.1 - Weight of a Car versus Miles per Gallon An...Ch. 4.1 - Hurricanes The data in the next column represent...Ch. 4.1 - CEO Performance The following data represent the...Ch. 4.1 - Bear Markets A bear market in the stock market is...Ch. 4.1 - Does Size Matter? Researchers wondered whether the...Ch. 4.1 - Prob. 34AYUCh. 4.1 - Weight of a Car versus Miles per Gallon Suppose...Ch. 4.1 - American Black Bears The website that contained...Ch. 4.1 - Draw Your Data! Consider the four data sets shown...Ch. 4.1 - Predicting Winning Percentage The ultimate goal in...Ch. 4.1 - Prob. 39AYUCh. 4.1 - Lyme Disease versus Drownings Lyme disease is an...Ch. 4.1 - Prob. 41AYUCh. 4.1 - Prob. 42AYUCh. 4.1 - Crime Rate and Cell Phones The linear correlation...Ch. 4.1 - Prob. 44AYUCh. 4.1 - Influential Consider the following set of data: a....Ch. 4.1 - Prob. 46AYUCh. 4.1 - Prob. 47AYUCh. 4.1 - Prob. 48AYUCh. 4.1 - What does it mean to say that the linear...Ch. 4.1 - What does it mean if r = 0?Ch. 4.1 - Prob. 51AYUCh. 4.1 - Prob. 52AYUCh. 4.1 - Explain the difference between correlation and...Ch. 4.1 - Suppose that two variables, x and y, are...Ch. 4.2 - The difference between the observed and predicted...Ch. 4.2 - If the linear correlation between two variables is...Ch. 4.2 - Prob. 3AYUCh. 4.2 - Prob. 4AYUCh. 4.2 - For the data set a. Draw a scatter diagram....Ch. 4.2 - For the data set a. Draw a scatter diagram....Ch. 4.2 - In Problems 712: a. By hand, draw a scatter...Ch. 4.2 - In Problems 712: a. By hand, draw a scatter...Ch. 4.2 - Prob. 9AYUCh. 4.2 - In Problems 712: a. By hand, draw a scatter...Ch. 4.2 - In Problems 712: a. By hand, draw a scatter...Ch. 4.2 - In Problems 712: a. By hand, draw a scatter...Ch. 4.2 - NW Income and Education In Problem 15 from Section...Ch. 4.2 - You Explain It! Study Time and Exam Scores After...Ch. 4.2 - Age Gap at Marriage Is there a relation between...Ch. 4.2 - You Explain It! CO2 and Energy Production The...Ch. 4.2 - NW An Unhealthy Commute (Refer to Problem 25,...Ch. 4.2 - Credit Scores (Refer to Problem 26, Section 4.1.)...Ch. 4.2 - Height versus Head Circumference (Refer to Problem...Ch. 4.2 - Prob. 20AYUCh. 4.2 - Weight of a Car versus Miles per Gallon (Refer to...Ch. 4.2 - Hurricanes (Refer to Problem 30, Section 4.1) The...Ch. 4.2 - Cola Consumption vs. Bone Density Example 5 in...Ch. 4.2 - Attending Class The following data represent the...Ch. 4.2 - CEO Performance (Refer to Problem 31 in Section...Ch. 4.2 - Bear Markets (Refer to Problem 32, Section 4.1) A...Ch. 4.2 - Male vs. Female Drivers (Refer to Problem 34,...Ch. 4.2 - Graduation Rates Go to...Ch. 4.2 - Putting It Together: Housing Prices One of the...Ch. 4.2 - Putting It Together: Smoking and Birth Weight It...Ch. 4.2 - What is a residual? What does it mean when a...Ch. 4.2 - Explain the phrase outside the scope of the model....Ch. 4.2 - Explain what each point on the least-squares...Ch. 4.3 - The _____ _____ _____, R2, measures the proportion...Ch. 4.3 - Total deviation = _____ deviation + _____...Ch. 4.3 - Match each coefficient of determination to a...Ch. 4.3 - NW The Other Old Faithful Perhaps you are familiar...Ch. 4.3 - Concrete As concrete cures, it gains strength. The...Ch. 4.3 - Prob. 7AYUCh. 4.3 - Problems 712 use the results from Problems 2530 in...Ch. 4.3 - Prob. 9AYUCh. 4.3 - Problems 712 use the results from Problems 2530 in...Ch. 4.3 - Problems 712 use the results from Problems 2530 in...Ch. 4.3 - Prob. 12AYUCh. 4.3 - Weight of a Car versus Miles per Gallon Suppose...Ch. 4.3 - American Black Bears Suppose that we find a bear...Ch. 4.3 - Putting It Together: Exam Scores The data below...Ch. 4.3 - Sullivan Survey II Go to...Ch. 4.4 - What is meant by a marginal distribution? What is...Ch. 4.4 - Refer to Table 8. Is constructing a conditional...Ch. 4.4 - Prob. 3AYUCh. 4.4 - Explain the idea behind Simpsons Paradox.Ch. 4.4 - In Problems 5 and 6, a. Construct a frequency...Ch. 4.4 - In Problems 5 and 6, a. Construct a frequency...Ch. 4.4 - Made in America In a recent Harris Poll, a random...Ch. 4.4 - Desirability Traits In a recent Harris Poll, a...Ch. 4.4 - NW Party Affiliation Is there an association...Ch. 4.4 - Prob. 10AYUCh. 4.4 - Health and Happiness The General Social Survey...Ch. 4.4 - Happy in Your Marriage? The General Social Survey...Ch. 4.4 - Prob. 13AYUCh. 4.4 - Treating Kidney Stones Researchers conducted a...Ch. 4.4 - Sullivan Survey II Go to...Ch. 4 - Basketball Spreads In sports betting, Las Vegas...Ch. 4 - Fat and Calories in Cheeseburgers A nutritionist...Ch. 4 - Prob. 3RECh. 4 - Prob. 4RECh. 4 - Prob. 5RECh. 4 - a. Draw a scatter diagram treating x as the...Ch. 4 - Use the results from Problems 2 and 4 to compute...Ch. 4 - Prob. 8RECh. 4 - Prob. 9RECh. 4 - New versus Used Car Satisfaction Are you more...Ch. 4 - Unemployment Rates Recessions are an economic...Ch. 4 - Prob. 12RECh. 4 - Prob. 13RECh. 4 - Prob. 1CTCh. 4 - Use the data from Problem 1. a. Find the...Ch. 4 - Use the results from Problems 1 and 2 to compute...Ch. 4 - The following data represent the speed of a car...Ch. 4 - Prob. 5CTCh. 4 - Prob. 6CTCh. 4 - Consider the following contingency table, which...Ch. 4 - What would you say about a set of quantitative...Ch. 4 - If the slope of a least-squares regression line is...Ch. 4 - What does it mean if a linear correlation...
Knowledge Booster


Learn more about
Need a deep-dive on the concept behind this application? Look no further. Learn more about this topic, statistics and related others by exploring similar questions and additional content below.Similar questions
- Calculate the 60th percentile of the data shown 2.7 7.3 9.6 10.1 12.1 21arrow_forwardFind a particular Integcal System. Dciginal Inhomageneous. for the %3Darrow_forwardThe distance (in kilometers) and price (in dollars) for one-way airline tickets from San Francisco to several cities are shown in the accompanying table. Complete parts a through d below. E Click the icon to view the data on airline ticket prices. a. Find the corelation coefficient for these data using a computer or statistical calculator. Use distance as the x-variable and price as the y-variable. (Round to three decimal places as needed.) r= b. Recalculate the correlation coefficient for these data using price as the x-variable and distance as the y-variable. What effect does this have on the correlation coefficient? Select the correct choice below and fill in the answer box to complete your choice. (Round to three decimal places as needed.) Airline Ticket Prices A. The correlation coefficient is r= The correlation coefficient decreases when the order of the variables is changed. B. The correlation coefficient is r= The correlation coefficient remains the same when the order of the…arrow_forward
- Breast-feedingmothers secrete calcium into their milk. Some of thecalcium may come from their bones, so mothers maylose bone mineral. Researchers measured the percent changein mineral content of the spines of 47 mothers during threemonths of breast-feeding.6 Here are the data: -4.7 -2.5 -4.9 -2.7 -0.8 -5.3 -8.3 -2.1 -6.8 -4.32.2 -7.8 -3.1 -1.0 -6.5 -1.8 -5.2 -5.7 -7.0 -2.2-6.5 -1.0 -3.0 -3.6 -5.2 -2.0 -2.1 -5.6 -4.4 -3.3-4.0 -4.9 -4.7 -3.8 -5.9 -2.5 -0.3 -6.2 -6.8 1.70.3 -2.3 0.4 -5.3 0.2 -2.2 -5.1 (a) The researchers are willing to consider these 47women as an SRS from the population of all nursingmothers. Suppose that the percent change in this population has standard deviation 2.5%. Make a stemplotof the data to verify that the data follow a Normal distribution quite closely. (Don’t forget that you need botha 0 and a 0 stem because there are both positive andnegative values.) (b) Use a 99% confidence interval to estimate the meanpercent change in the populationarrow_forwardPlease write complete thx. Penicillin is produced by the Penicillium fungus, which is grown in a broth whose sugar content must be carefully controlled. Several samples of broth were taken on each of three successive days, and the amount of dissolved sugars (in mg/mL) was measured on each sample. The results were as follows: Day 1 4.6 4.9 5.0 4.8 5.2 4.9 Day 2 5.0 5.0 5.1 5.5 5.1 5.3 Day 3 5.7 5.6 5.3 5.5 5.4 5.4 6.2 5.3 a) State the appropriate hypotheses to test for a difference in means. b) Construct the appropriate ANOVA table. c) Use the ANOVA table from part b) to test whether there is a difference in the mean amount of dissolved sugars between the three days at the .05 level. d) Is it applicable to follow up with Tukey-Kramer pairwise comparisons? If so, determine which pair(s) of means are significantly different using the Tukey-Kramer method. If not, explain why not.arrow_forwardFind the coefficient of determination if SSE = 50 and SSR = 90.arrow_forward
- Harvard univeruses the following grade scale: A+ = 4.0 C+ = 2.5 F = 0.0 A = 4.0 C = 2.0 B+ = 3.5 D+ = 1.5 B = 3.0 D = 1.0 A student was taking 5 different courses the past semester, and received their grades. Calculate the student's weighted grade point average if they received the following grades in their five courses. The letter grade and weight for that course's grade are included in the table below: Subject Grade Credits (weights) Biology A 3 Chemistry B 4 Math A 3 English C+ 2 Psychology B+ 4 Round your answer to 2 decimal places.arrow_forwardDr. Seboo has collected the total cholesterol levels of all his patients. He is trying to figure what the typical cholesterol level falls. Use the following output to answer the questions. a. What variable was recorded in the data collected? Classify the variable as categorical or quantitative.Variable: ______________________ Circle one: Categorical or Quantitativeb. Describe the shape of the above distribution:c. The average cholesterol level was _______________, and 50% of this sample cholesterol levels was ________________ or more. The minimum cholesterol level was _______________, while the maximum number cholesterol level was _________________. The middle 50% of cholesterol levels in this sample were between ______________ and ______________. According to _____________________________ Rule, we expect ________% of the cholesterol levels to be between ________________ and _______________ (two standard deviations from the mean).d. Construct a 95% confidence interval for the mean…arrow_forwardA hospital is using X bar and R charts to record the time it takes to process patient account information. A sample of five applications is taken each day. The first four weeks’ (20 days’) data give the following values: =16 min =7 min If the upper and lower specifications are 21 minutes and 13 minutes respectively, calculate , Cp and Cpk. Interpret the indices.arrow_forward
arrow_back_ios
arrow_forward_ios
Recommended textbooks for you
 Algebra: Structure And Method, Book 1AlgebraISBN:9780395977224Author:Richard G. Brown, Mary P. Dolciani, Robert H. Sorgenfrey, William L. ColePublisher:McDougal Littell
 College Algebra (MindTap Course List)AlgebraISBN:9781305652231Author:R. David Gustafson, Jeff HughesPublisher:Cengage Learning
 Mathematics For Machine TechnologyAdvanced MathISBN:9781337798310Author:Peterson, John.Publisher:Cengage Learning,
 Holt Mcdougal Larson Pre-algebra: Student Edition...AlgebraISBN:9780547587776Author:HOLT MCDOUGALPublisher:HOLT MCDOUGAL
 Glencoe Algebra 1, Student Edition, 9780079039897...AlgebraISBN:9780079039897Author:CarterPublisher:McGraw Hill
Algebra: Structure And Method, Book 1
Algebra
ISBN:9780395977224
Author:Richard G. Brown, Mary P. Dolciani, Robert H. Sorgenfrey, William L. Cole
Publisher:McDougal Littell
College Algebra (MindTap Course List)
Algebra
ISBN:9781305652231
Author:R. David Gustafson, Jeff Hughes
Publisher:Cengage Learning
Mathematics For Machine Technology
Advanced Math
ISBN:9781337798310
Author:Peterson, John.
Publisher:Cengage Learning,
Holt Mcdougal Larson Pre-algebra: Student Edition...
Algebra
ISBN:9780547587776
Author:HOLT MCDOUGAL
Publisher:HOLT MCDOUGAL
Glencoe Algebra 1, Student Edition, 9780079039897...
Algebra
ISBN:9780079039897
Author:Carter
Publisher:McGraw Hill
The Shape of Data: Distributions: Crash Course Statistics #7; Author: CrashCourse;https://www.youtube.com/watch?v=bPFNxD3Yg6U;License: Standard YouTube License, CC-BY
Shape, Center, and Spread - Module 20.2 (Part 1); Author: Mrmathblog;https://www.youtube.com/watch?v=COaid7O_Gag;License: Standard YouTube License, CC-BY
Shape, Center and Spread; Author: Emily Murdock;https://www.youtube.com/watch?v=_YyW0DSCzpM;License: Standard Youtube License