
Videos
Iguana Decline In 1987, Martin Wikelski began a long-term study of marine iguanas in the Galápagos Islands. He marked iguanas on two islands—Genovesa and Santa Fe—and collected data on how their body size, survival, and reproductive rates varied over time. He found that because iguanas eat algae and have no predators, deaths usually result from food shortages, disease, or old age. In January 2001, an oil tanker ran aground and leaked a small amount of oil into the waters near Santa Fe. FIGURE 44.3 shows the number of marked iguanas that Wikelski and his team counted in their study populations just before the spill and about a year later.
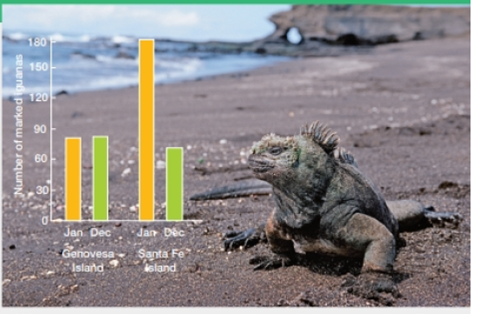
FIGURE 44.3 Shifting numbers of marked marine iguanas on two Galápagos islands. An oil spill occurred near Santa Fe just after the January 2001 census (orange bars). A second census was carried out in December 2001 (green bars).
Which island had more marked iguanas at the time of the first census?
To examine: The Island that has a greater population size of marine during the first census study.
Concept introduction: Marine iguanas are kind of reptiles but unique among the modern lizards. They feed on algae and large species find its food source on the tidal region as they live in rocky shores. These are currently considered as threatened species due to the poaching, negative effects of introduced species, loss, and fragmentation of habitat. Many NGO’s and program researchers have taken part in protecting these species by creating artificial nesting sites.
Explanation of Solution
The research group of Person M conducted the long- term study of marine iguanas in Galapagos Islands. The study on the population of marine iguanas was done on island Gen and island SF in the year 2001. This study tells about their body size, survival, and the reproductive rate over the period of time. During this year, the oil spill occurred near the island SF and led to the loss of marine iguanas species. They observed the population of marked marine iguanas on two islands over the period of a year by conducting two surveys.
Refer Fig. 44.3, “Shifting numbers of marked marine iguanas on two Galapagos islands” in the textbook. The graphical representation shows the number of marked iguanas in island Gen and island SF. Marked iguanas are identified on both islands. The island that had greater number of marked marine iguana population at the time of the first census is island SF.
Compared to island Gen, island SF has more marked marine iguanas during the first census study.
Want to see more full solutions like this?
Chapter 44 Solutions
Biology: The Unity and Diversity of Life (MindTap Course List)
Additional Science Textbook Solutions
Human Physiology: An Integrated Approach (7th Edition)
Campbell Essential Biology (6th Edition) - standalone book
Microbiology with Diseases by Taxonomy (5th Edition)
Campbell Biology in Focus (2nd Edition)
Human Anatomy (8th Edition)


- Iguana Decline In 1987, Martin Wikelski began a long-term study of marine iguanas in the Galpagos Islands. He marked iguanas on two islandsGenovesa and Santa Feand collected data on how their body size, survival, and reproductive rates varied over time. He found that because iguanas eat algae and have no predators, deaths usually result from food shortages, disease, or old age. In January 2001, an oil tanker ran aground and leaked a small amount of oil into the waters near Santa Fe. FIGURE 44.3 shows the number of marked iguanas that Wikelski and his team counted in their study populations just before the spill and about a year later. FIGURE 44.3 Shifting numbers of marked marine iguanas on two Galpagos islands. An oil spill occurred near Santa Fe just after the January 2001 census (orange bars). A second census was carried out in December 2001 (green bars). How much did the population size on each island change between the first and second census?arrow_forwardIguana Decline In 1987, Martin Wikelski began a long-term study of marine iguanas in the Galpagos Islands. He marked iguanas on two islandsGenovesa and Santa Feand collected data on how their body size, survival, and reproductive rates varied over time. He found that because iguanas eat algae and have no predators, deaths usually result from food shortages, disease, or old age. In January 2001, an oil tanker ran aground and leaked a small amount of oil into the waters near Santa Fe. FIGURE 44.3 shows the number of marked iguanas that Wikelski and his team counted in their study populations just before the spill and about a year later. FIGURE 44.3 Shifting numbers of marked marine iguanas on two Galpagos islands. An oil spill occurred near Santa Fe just after the January 2001 census (orange bars). A second census was carried out in December 2001 (green bars). Wikelski concluded that changes on Santa Fe were the result of the oil spill, rather than sea temperature or other climate factors common to both islands. How would the census numbers be different from those he observed if an adverse event had affected both islands?arrow_forwardIguana Decline In 1987, Martin Wikelski began a long-term study of marine iguanas in the Calapgos Islands. He marked iguanas on two islandsGenovesa and Santa Feand collected data on how their body size, survival, and reproductive rates varied over time. He found that because iguanas eat algae and have no predators, deaths usually result from food shortages, disease, or old age. In January 2001, an oil tanker ran aground and leaked a small amount of oil into the waters near Santa Fe. FIGURE 44.17 shows the number of marked iguanas that Wikelski and his team counted in their study populations just before the spill and about a year later. FIGURE 44.17 Shifting numbers of marked marine iguanas on two Galpagos islands. An oil spill occurred near Santa Fe just after the January 2001 census (orange bars). A second census was carried out in December 2001 (green bars). 3. Wikelski concluded that changes on Santa He were the result of the oil spill, rather than sea temperature or other climate factors common to both islands. How would the census numbers be different from those he observed if an adverse event had affected both Islands?arrow_forward
- Peter and Rosemary Grant of Princeton University have studied the ecology and evolution of finches on the Galapagos Islands since the early 1970s. They have shown that finches with large bills (as measured by bill depth; see Figure) can eat both small seeds and large seeds, but finches with small bills can only eat small seeds. In 1977, a severe drought on the island of Daphne Major reduced seed production by plants. After the birds consumed whatever small seeds they found, only large seeds were still available. The resulting food shortage killed a majority of the medium ground finches (Geospizafortis) on Daphne Major; their population plummeted from 751 in 1976 to just 90 in 1978. The Grants research also documented a change in the distributions of bill depths in the birds from 1976 to 1978, as illustrated in the graphs to the right. In light of what you now know about the relationship between bill size and food size for these birds, interpret the change illustrated in the graph. What type of natural selection does this example illustrate? Source: P. R. Grant. 1986. Ecology and Evolution of Darwins Finches. Princeton University Press.arrow_forwardShrimp fishing off the coast of Georgia was closed in 2001, due to a drastic reduction in the shrimp population. Landings of blue crab plummeted in 2002 and 2003, as five years of drought and greatly reduced freshwater flow from underground aquifers led to increased salinity in coastal estuaries. These habitats between open ocean and fresh water are the “nurseries’ for many marine animals. Using information you learned in this lab, speculate about possible causes for the decline in shrimp and blue crab populations.arrow_forwardPart A)DR TJ freaks out because she doesn’t hear any cicadas singing in January. If she understood the biology of these animals she would know that was because adult cicadas do not emerge from underground until summer! Dr TJ should have a better understanding of the importance of ___ in studying ecology. timing spatial distributions none of these Part B)If I read 50 papers on phenotypic plasticity in sea stars and they all showed that these animals exhibit behaviors that allow them to persist under temperature stress, this would be an example of ____ in science. detection measurement repeatabilityarrow_forward
- Shrimp fishing off the coast of Georgia was closed in 2001, due to a drastic reduction in the shrimp population. Landings of blue crab plummeted in 2002 and 2003, as five years of drought and greatly reduced freshwater flow from underground aquifers led to increased salinity in coastal estuaries. These habitats between open ocean and fresh water are “nurseries” for many marine animals. Speculate about possible causes for the decline in shrimp and blue crab populations.arrow_forwardMilkfish (Chanos chanos) is the only fish species that belongs to Family Chanidae which is nearly related to tuna and salmon due to its fusiform shape and migratory nature. It is widely distributed in the Indo-pacific region and abundantly collected in the South and Southeast Asian, and West Pacific Regions. Milkfish is one of the most commercially important fish species in the Philippines. Milkfish reach sexual maturity (approximately 1.5m length and 20 kg weight) in five years in large floating cages, but may take 8-10 years in ponds and concrete tanks. In the natural environment, milkfish populations near the coral reefs spawn during warm months of the year while populations near the equator spawn year-round. First-time spawners produce fewer eggs but larger and older broodstocks produce as many eggs as wild adults of similar size. Broodstocks of about 8 years old and about 6 kg produce 3-4 million eggs. Juvenile and adults milkfish eat a wide variety of relatively soft and small…arrow_forwardIntroduction The Rock Pocket Mouse The rock pocket mouse, Chaetodipus intermedius, is a small, nocturnal animal found in the deserts of thesouthwestern United States. Most rock pocket mice have a sandy, light-colored coat that enables them to blendin with the light color of the desert rocks and sand on which they live. However, populations of primarily dark-colored rock pocket mice have been found living in areas where the ground is covered in a dark rock calledbasalt caused by geologic lava flows thousands of years ago. Scientists have collected data from a population ofprimarily dark-colored mice living in an area of basalt called the Pinacate lava flow in Arizona, as well as from anearby light-colored population. Researchers analyzed the data from these two populations in search of thegenetic mutation responsible for the dark coat color. Their analyses led to the discovery of a mutation in theMc1r gene that is involved in coat-color determination. The MC1R Gene Two pigments…arrow_forward
- The type III survivorship curve is found in species in which most individuals die when they are young but a relatively small number of older individuals can live for a long time. Many of these organisms have very long lifespans. This would appear to contradict the evolutionary theory of aging because most individuals die when young but lifespan is long. How can you explain this apparent contradiction. Group of answer choices -older, larger individuals have most of the offspring -all type III organisms have very slow metabolisms -type III organisms are trying to prove evolution wrong -type III organisms die at a constant ratearrow_forwardBurmese pythons are native to southeast Asia but have become popular pets over the last few decades. Over time, escaped and released pythons have made their way into Everglades National Park, Florida, USA where they have displaced many native What term best describes the Burmese pythons in Everglades National Park?arrow_forwardWhat is the main idea of this text? In the years right after the invasion, zebra mussels evolved and adapted to the Hudson River ecosystem. In the years right after the invasion, zebra mussels evolved and adapted to the Hudson River ecosystem. In the years right after the invasion, zebra mussels caused a number of changes in the Hudson River ecosystem and food web. In the years right after the invasion, zebra mussels caused a number of changes in the Hudson River ecosystem and food web. In the years right after the invasion, zebra mussels did not have a major impact on the Hudson River ecosystem or food web. In the years right after the invasion, zebra mussels did not have a major impact on the Hudson River ecosystem or food web. At first, zebra mussels did not have any impact on the Hudson River ecosystem, but their impact increased over timearrow_forward
 Biology: The Unity and Diversity of Life (MindTap...BiologyISBN:9781305073951Author:Cecie Starr, Ralph Taggart, Christine Evers, Lisa StarrPublisher:Cengage Learning
 Biology: The Unity and Diversity of Life (MindTap...BiologyISBN:9781337408332Author:Cecie Starr, Ralph Taggart, Christine Evers, Lisa StarrPublisher:Cengage Learning
 Biology Today and Tomorrow without Physiology (Mi...BiologyISBN:9781305117396Author:Cecie Starr, Christine Evers, Lisa StarrPublisher:Cengage Learning
 Biology: The Dynamic Science (MindTap Course List)BiologyISBN:9781305389892Author:Peter J. Russell, Paul E. Hertz, Beverly McMillanPublisher:Cengage Learning
 Concepts of BiologyBiologyISBN:9781938168116Author:Samantha Fowler, Rebecca Roush, James WisePublisher:OpenStax College
 Biology (MindTap Course List)BiologyISBN:9781337392938Author:Eldra Solomon, Charles Martin, Diana W. Martin, Linda R. BergPublisher:Cengage Learning