
Introduction To Statistics And Data Analysis
6th Edition
ISBN: 9781337793612
Author: PECK, Roxy.
Publisher: Cengage Learning,
expand_more
expand_more
format_list_bulleted
Videos
Textbook Question
Chapter 4.4, Problem 52E
The paper “Study of the Flying Ability of Rhynchophorus ferrugineus Adults Using a Computer-Monitored Mill” (Bulletin of Entomological Research [2014]: 462–467) summarized data from a study of red palm weevils, a pest that is a threat to palm trees. The following frequency distribution from the paper was constructed using the longest flight (in meters) observed for 132 weevils.
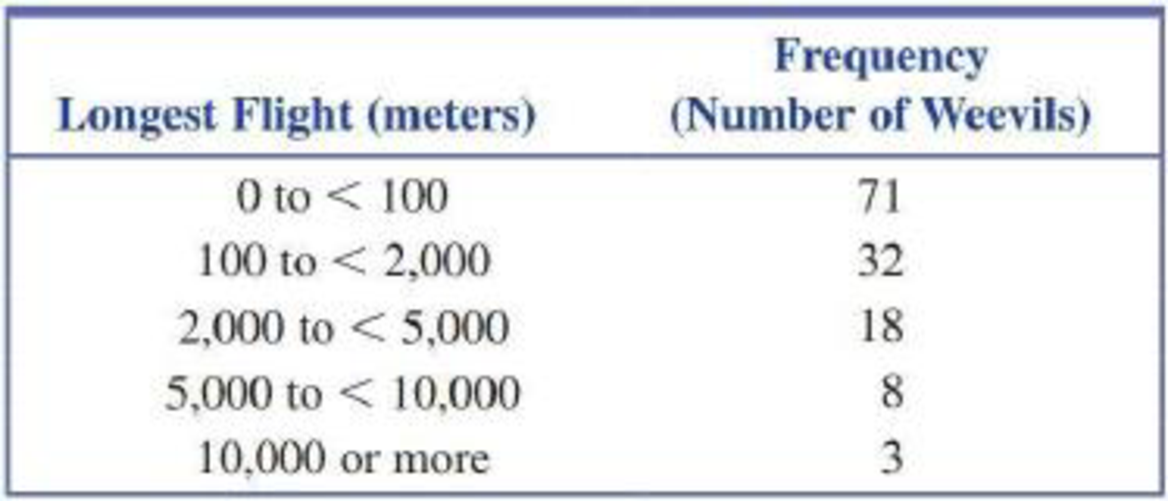
Estimate the approximate values of the following percentiles:
- a. 54th
- b. 80th
- c. 92nd
Expert Solution & Answer
Want to see the full answer?
Check out a sample textbook solution
Students have asked these similar questions
The accompanying frequency distribution on depositedenergy (mJ) was extracted from the article “ExperimentalAnalysis of Laser-Induced Spark Ignition of LeanTurbulent Premixed Flames” (Combustion and Flame,2013: 1414–1427).1.0− , 2.0 5 2.0− , 2.4 112.4− , 2.6 13 2.6− , 2.8 302.8− , 3.0 46 3.0− , 3.2 663.2− , 3.4 133 3.4− , 3.6 1413.6− , 3.8 126 3.8− , 4.0 924.0− , 4.2 73 4.2− , 4.4 384.4− , 4.6 19 4.6− , 5.0 11a. What proportion of these ignition trials resulted in adeposited energy of less than 3 mJ?b. What proportion of these ignition trials resulted in adeposited energy of at least 4 mJ?c. Roughly what proportion of the trials resulted in adeposited energy of at least 3.5 mJ?d. Construct a histogram and comment on its shape.
The accompanying frequency distribution of fracturestrength (MPa) observations for ceramic bars fired in aparticular kiln appeared in the article “Evaluating TunnelKiln Performance” (Amer. Ceramic Soc. Bull., Aug.1997: 59–63).Class 812,83 832,85 852,87 872,89 892,91Frequency 6 7 17 30 43Class 912,93 932,95 952,97 972,99Frequency 28 22 13 3a. Construct a histogram based on relative frequencies,and comment on any interesting features.b. What proportion of the strength observations are atleast 85? Less than 95?c. Roughly what proportion of the observations are lessthan 90?
A Canadian study measuring depression level in teens (as reported in the Journal of Adolescence, vol. 25, 2002) randomly sampled 112 male teens and 101 female teens, and scored them on a common depression scale (higher score representing more depression). The researchers suspected that the mean depression score for male teens is higher than for female teens, and wanted to check whether data would support this hypothesis.
If μ1 and μ2 represent the mean depression score for male teens and female teens respectively, which of the following is an appropriate pair of hypotheses in this case? Check all that apply.
Chapter 4 Solutions
Introduction To Statistics And Data Analysis
Ch. 4.1 - The following are the prices (in dollars) of the...Ch. 4.1 - The article Caffeine Content of Drinks...Ch. 4.1 - Consumer Reports Health...Ch. 4.1 - Consumer Reports Health...Ch. 4.1 - The article The Wedding Industrys Pricey Little...Ch. 4.1 - The state of California defines family income...Ch. 4.1 - The report State of the News Media 2015 (Pew...Ch. 4.1 - Each student in a sample of 20 seniors at a...Ch. 4.1 - The U.S. Department of Transportation reported the...Ch. 4.1 - The ministry of Health and Long-Term Care in...
Ch. 4.1 - Houses in California are expensive, especially on...Ch. 4.1 - Consider the following statement: More than 65% of...Ch. 4.1 - A sample consisting of four pieces of luggage was...Ch. 4.1 - Suppose that 10 patients with meningitis received...Ch. 4.1 - A study of the lifetime (in hours) for a certain...Ch. 4.1 - An instructor has graded 19 exam papers submitted...Ch. 4.2 - The following data are costs (in cents) per ounce...Ch. 4.2 - Cost per serving (in cents) for six high-fiber...Ch. 4.2 - Combining the cost-per-serving data for high-fiber...Ch. 4.2 - Prob. 20ECh. 4.2 - The accompanying data are consistent with summary...Ch. 4.2 - The paper referenced in the previous exercise also...Ch. 4.2 - The price (in dollars) of the eight smart phones...Ch. 4.2 - In addition to the prices of the highly rated...Ch. 4.2 - In an experiment to assess the effect of listening...Ch. 4.2 - The paper referenced in the previous exercise also...Ch. 4.2 - The accompanying data on number of minutes used...Ch. 4.2 - Give two sets of five numbers that have the same...Ch. 4.2 - Morningstar is an investment research from that...Ch. 4.2 - The U.S. Department of Transportation reported the...Ch. 4.2 - The Ministry of Health and Long-Term Care in...Ch. 4.2 - In 1997, a woman sued a computer keyboard...Ch. 4.2 - The standard deviation alone does not measure...Ch. 4.3 - Based on a large national sample of working...Ch. 4.3 - The report Most Licensed Drivers Age 85+: States...Ch. 4.3 - Data on the gasoline tax per gallon (in cents) in...Ch. 4.3 - The U.S. Department of Health and Human Services...Ch. 4.3 - Fiber content (in grns per serving) for 18 high...Ch. 4.3 - In addition to the fiber contents given in the...Ch. 4.3 - Use the fiber content and sugar content data given...Ch. 4.3 - The article The Bestand WorstPlaces to be a...Ch. 4.4 - The average playing time of music albums in a...Ch. 4.4 - In a study investigating the effect of car speed...Ch. 4.4 - The U.S. Census Bureau (2000 census) reported the...Ch. 4.4 - For the travel time distribution given in the...Ch. 4.4 - Use the information given in the previous two...Ch. 4.4 - Mobile homes are tightly constructed for energy...Ch. 4.4 - The article Impact of Berkeley Excise Tax on...Ch. 4.4 - A student took two national aptitude tests. The...Ch. 4.4 - Suppose that your younger sister is applying for...Ch. 4.4 - The report Who Borrows Most? Bachelors Degree...Ch. 4.4 - The paper Study of the Flying Ability of...Ch. 4.4 - Suppose that the manufacturer of a scale claims...Ch. 4.4 - Suppose that your statistics professor returned...Ch. 4.4 - The paper Answer Changing in Multiple Choice...Ch. 4.4 - Suppose that the average reading speed of students...Ch. 4.4 - The following data values are 2014 per capita...Ch. 4.4 - The accompanying table gives the mean and standard...Ch. 4.5 - The authors of the paper Delayed Time to...Ch. 4.5 - The paper Portable Social Groups: Willingness to...Ch. 4 - Acrylamide (a possible cancer-causing substance)...Ch. 4 - Prob. 62CRCh. 4 - Because some homes have selling prices that are...Ch. 4 - Although bats are not known for their eyesight,...Ch. 4 - For the data in the previous exercise, subtract 10...Ch. 4 - For the data of Exercise 4.64, multiply each data...Ch. 4 - The Bloomberg web site included the data in the...Ch. 4 - Refer to the data given in the previous exercise....Ch. 4 - Age at diagnosis for each of 20 patients under...Ch. 4 - Suppose that the distribution of scores on an exam...
Knowledge Booster


Learn more about
Need a deep-dive on the concept behind this application? Look no further. Learn more about this topic, statistics and related others by exploring similar questions and additional content below.Similar questions
- A suburban hotel derives its revenue from its hotel and restaurant operations. Theowners are interested in the relationship between the number of rooms occupied on anightly basis and the revenue per day in the restaurant. Below is a sample of 25 days(Monday through Thursday) from last year showing the restaurant income and numberof rooms occupied.arrow_forwardBased on a survey of a random sample of 900 adults in the United States, a journalist reports that A random sample of 100 movie goers was asked to state his or her gender and favorite soft drink available at the local movie theater. The results appear in the table below. Is there a relationship between gender and soft drink preference? Coke Diet Coke Sprite Male 23 11 12 Female 16 28 10 To analyze the results, which of the following tests is most appropriate? A)Chi-square test of independence B)Chi-square test of homogeneity C)Two sample t-test D)Matched pair t-test E)Chi-square goodness of fitarrow_forwardOn snow-covered roads, winter tires enable a car to stop in a shorter distance than if summer tires were installed. In terms of the additive model for one-way ANOVA, and for an experiment in which the mean stopping distances on a snow-covered road are measured for each of four brands of winter tires. If the data are as shown in Sheet 48, what conclusion would be reached at the 0.01 level of significance? Shett 48 Supplier A 517 484 463 452 502 447 481 500 485 566 Supplier B 479 499 488 430 482 457 424 488 526 455 Supplier C 435 443 480 465 435 430 465 514 463 510 Supplier D 526 537 443 505 468 533 481 477 490 470 Select one: a) p-value = 0.28 greater than 0.05, the average distance is different for at list two tires b) F stat = 1.86, F crit = 4.38, not enough evidence to claim that the average distance is different for at list two tires c) F ratio = 4.38, not enough evidence to claim that the average distance is different for at list two tires d) F stat = 0.68, F…arrow_forward
- The article “Wind-Uplift Capacity of Residential Wood Roof-Sheathing Panels Retrofitted with Insulating Foam Adhesive” (P. Datin, D. Prevatt, and W. Pang, Journal of Architectural Engineering, 2011:144–154) presents a study of the failure pressures of roof panels. Following are the failure pressures, in kPa, for five panels constructed with 6d smooth shank nails. These data are consistent with means and standard deviations presented in the article. 3.32 2.53 3.45 2.38 3.01 Find a 95% confidence interval for the mean failure pressure for this type of roof panel.arrow_forwardThe management of ‘AL-Baik ’ studied the waiting times of customer’s for dine in or take away of food in waiting area before food is delivered to them. The following data with waiting times in minutes were collected over a one-day period. Consider the following data in Table 2.1: Table 2.1 63 55 46 48 64 45 67 51 63 59 61 50 61 41 41 69 69 54 52 57 53 53 63 56 67 44 61 46 60 50 a) Develop a frequency distribution using classes of 40–45, 46–51, 52–57, 58–63, and 64–69. b) Develop a relative frequency distribution and a percent frequency distribution. c) Cumulative frequency and a cumulative relative frequency.arrow_forwardThe following categories for type of physical activityinvolved when an industrial accident occurred appearedin the article “Finding Occupational Accident Patternsin the Extractive Industry Using a Systematic DataMining Approach” (Reliability Engr. and SystemSafety, 2012: 108–122):A. Working with handheld toolsB. MovementC. Carrying by handD. Handling of objectsE. Operating a machineF. OtherConstruct a frequency distribution, including relativefrequencies, and histogram for the accompanying datafrom 100 accidents (the percentages agree with those inthe cited article): A B D A A F C A C B E B A CF D B C D A A C B E B C E AB A A A B C C D F D B B A FC B A C B E E D A B C E A AF C B D D D B D C A F A A BD E A E D B C A F A C D D AA B A F D C A C B F D A E AC Darrow_forward
- A study was done to determine if the time of day affected ther performance of a certain alegebra class. the same class was used in the experiment over a 6-day time span.arrow_forwardAn article in the Journal of Quality Technology (Vol. 13, No. 2, 1981, pp. 111–114) describes an experimentthat investigates the effects of four bleaching chemicals on pulp brightness. These four chemicals wereselected at random from a large population of potential bleaching agents. The data are as follows:a. Test the significance of these chemical types with α=0.05.b. If proven significant, perform a multiple comparison method using Fisher’s LSDarrow_forwardNutritionResearchers compared protein intake among threegroups of postmenopausal women: (1) women eating astandard American diet (STD), (2) women eating a lactoovo-vegetarian diet (LAC), and (3) women eating a strictvegetarian diet (VEG). The mean ± 1 sd for protein intake(mg) is presented in Table 12.29. 12.5 Using the data in Table 12.29, perform a multiplecomparisons procedure to identify which specific underlyingmeans are different.arrow_forward
- The following SPSS output examines the percent of security staff that is female at private and public prisons. Based on the output answer the question below. The assumption of homogeneity of variance is met. True Falsearrow_forwardA sample of 77 individuals working at a particular office was selected and the noise level (dBA) experienced by each individual was determined, yielding the following data (“Acceptable Noise Levels for Construction Site Offices,” Building Serv. Engr. Research and Technology, 2009: 87–94). 55.3 55.3 55.3 55.9 55.9 55.9 55.9 56.1 56.1 56.1 56.1 56.1 56.1 56.8 56.8 57 57 57 57.8 57.8 57.8 57.9 57.9 57.9 58.8 58.8 58.8 59.8 59.8 59.8 62.2 62.2 63.8 63.8 63.8 63.9 63.9 63.9 64.7 64.7 64.7 65.1 65.1 65.1 65.3 65.3 65.3 65.3 67.4 67.4 67.4 67.4 68.7 68.7 68.7 68.7 69 70.4 70.4 71.2 71.2 71.2 73 73 73.1 73.1 74.6 74.6 74.6 74.6 79.3 79.3 79.3 79.3 83 83 83 Use various techniques discussed in Descriptive Statistics lectures including visualizations to organize, summarize, and describe the data.arrow_forwardThe types of browse favored by deer are shown in the following table. Using binoculars, volunteers observed the feeding habits of a random sample of 320 deer.Type of Browse Plant Compositionin Study Area Observed Number of DeerFeeding on This PlantSage brush 32% 98 Rabbit brush 38.7% 134 Salt brush 12% 38 Service berry 9.3% 27 Other 8% 23 A button hyperlink to the SALT program that reads: Use SALT.Use a 5% level of significance to test the claim that the natural distribution of browse fits the deer feeding pattern.(a) What is the level of significance? State the null and alternate hypotheses.H0: The distributions are the same.H1: The distributions are the same.H0: The distributions are different.H1: The distributions are different. H0: The distributions are the same.H1: The distributions are different.H0: The distributions are different.H1: The distributions are the same. (b) Find the value of the chi-square statistic for the sample. (Round the expected frequencies to at least three…arrow_forward
arrow_back_ios
SEE MORE QUESTIONS
arrow_forward_ios
Recommended textbooks for you
 MATLAB: An Introduction with ApplicationsStatisticsISBN:9781119256830Author:Amos GilatPublisher:John Wiley & Sons Inc
 Probability and Statistics for Engineering and th...StatisticsISBN:9781305251809Author:Jay L. DevorePublisher:Cengage Learning
 Statistics for The Behavioral Sciences (MindTap C...StatisticsISBN:9781305504912Author:Frederick J Gravetter, Larry B. WallnauPublisher:Cengage Learning
 Elementary Statistics: Picturing the World (7th E...StatisticsISBN:9780134683416Author:Ron Larson, Betsy FarberPublisher:PEARSON
 The Basic Practice of StatisticsStatisticsISBN:9781319042578Author:David S. Moore, William I. Notz, Michael A. FlignerPublisher:W. H. Freeman
 Introduction to the Practice of StatisticsStatisticsISBN:9781319013387Author:David S. Moore, George P. McCabe, Bruce A. CraigPublisher:W. H. Freeman
MATLAB: An Introduction with Applications
Statistics
ISBN:9781119256830
Author:Amos Gilat
Publisher:John Wiley & Sons Inc
Probability and Statistics for Engineering and th...
Statistics
ISBN:9781305251809
Author:Jay L. Devore
Publisher:Cengage Learning
Statistics for The Behavioral Sciences (MindTap C...
Statistics
ISBN:9781305504912
Author:Frederick J Gravetter, Larry B. Wallnau
Publisher:Cengage Learning
Elementary Statistics: Picturing the World (7th E...
Statistics
ISBN:9780134683416
Author:Ron Larson, Betsy Farber
Publisher:PEARSON
The Basic Practice of Statistics
Statistics
ISBN:9781319042578
Author:David S. Moore, William I. Notz, Michael A. Fligner
Publisher:W. H. Freeman
Introduction to the Practice of Statistics
Statistics
ISBN:9781319013387
Author:David S. Moore, George P. McCabe, Bruce A. Craig
Publisher:W. H. Freeman
Introduction to experimental design and analysis of variance (ANOVA); Author: Dr. Bharatendra Rai;https://www.youtube.com/watch?v=vSFo1MwLoxU;License: Standard YouTube License, CC-BY