
Videos
The authors of the paper “Delayed Time to Defibrillation after In-Hospital Cardiac Arrest” (New England Journal of Medicine [2008]: 9–16) described a study of how survival is related to the length of time it takes from the time of a heart attack to the administration of defibrillation therapy. The following is a statement from the paper:
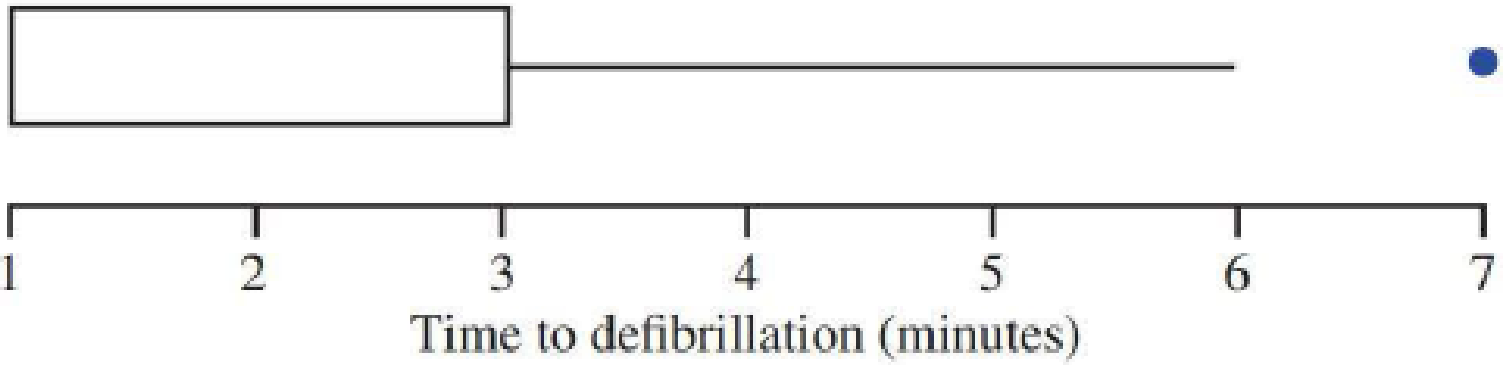
We identified 6789 patients from 369 hospitals who had in-hospital cardiac arrest due to ventricular fibrillation (69.7%) or pulseless ventricular trachycardia (30.3%). Overall, the median time to defibrillation was 1 minute (
Data from the paper on time to defibrillation in minutes) for these 6789 patients was used to produce the Minitab output and boxplot at the bottom of the page.
- a. Why is there no lower whisker in the given boxplot?
- b. How is it possible for the median, the lower
quartile , and the minimum value in the data set to all be equal? (Note—this is why you do not see a median line in the box part of the boxplot.) - c. The authors of the paper considered a time to defibrillation of greater than 2 minutes as unacceptable. Based on the given boxplot and summary statistics, is it possible that the percentage of patients having an unacceptable time to defibrillation is greater than 50%? Greater than 25%? Less than 25%? Explain.
- d. Is the outlier shown at 7 a mild outlier or an extreme outlier?


Trending nowThis is a popular solution!

Chapter 4 Solutions
Introduction To Statistics And Data Analysis
Additional Math Textbook Solutions
Elementary Statistics (13th Edition)
Essential Statistics
Elementary Statistics: Picturing the World (6th Edition)
Statistical Reasoning for Everyday Life (5th Edition)
Statistics Through Applications
Statistics for Business & Economics, Revised (MindTap Course List)


- The article “Effects of Diets with Whole Plant-Origin Proteins Added with Different Ratiosof Taurine:Methionine on the Growth, Macrophage Activity and Antioxidant Capacity ofRainbow Trout (Oncorhynchus mykiss) Fingerlings” (O. Hernandez, L. Hernandez, et al.,Veterinary and Animal Science, 2017:4-9) reports that a sample of 210 juvenile rainbowtrout fed a diet fortified with equal amounts of the amino acids taurine and methionine for aperiod of 70 days had a mean weight gain of 313 percent with a standard deviation of 25, while 210 fish fed with a control diet had a mean weight gain of 233 percent with a standard deviation of 19. Units are percent. Find a 99% confidence interval for the difference in weight gain on the two diets.arrow_forwardIn a study reported in the July 2007 issue of the Journal of Epidemiology and Community Health, researchers investigated whether veterans are more likely to commit suicide than nonveterans. They spent 12 years following 104,000 veterans who had served in the armed forces between 1917 and 1994, and compared them with 216,000 nonveterans. They found that 197 veterans and 311 nonveterans committed suicide. Q: How many times more times is a veteran likely to commit suicide than a nonveteran? Round all values to 3 decimal places. Show as much work as possible.arrow_forwardDo well-rounded people get fewer colds? A study on the Chronicle of Higher Education was conducted by scientist at Carnegie Mellon University, the University of Pittsburgh and the University of Virginia. They found that people who have only a few social outlets get more colds than those who are involved in a variety of social activities. Suppose that of the 276 healthy men and women tested, n1=96 had only a few social outlets and n2=105 were busy with six or more activities. When these people were exposed to a cold virus, the following results were observed: Construct a 99% confidence interval for the difference in the two population proportions.arrow_forward
- A sample of men and women who had passed their driver's test either the first time or the second time were surveyed, with the following results: Results of the driving testGender First time Second timeMen 126 211Women 135 178a) Do these data suggest that there is a relationship between gender and the passing of their driver’s test from which the present sample was drawn? Let alpha=.05arrow_forwardIn a Japanese study, “researchers looked at 35 peoplewith lower back pain who were enrolled in an aquatic exercise program, which included swimming and walk-ing in a pool. Almost all of the patients showed improve-ments after six months, but the researchers found that those who participated at least twice weekly showedmore significant improvement that those who wentonly once per week.”Which of the following statements is true?a) This experiment proves that swimming causes areduction in lower back pain.b) This study is a poorly designed experiment sincethere is no control group and no randomization.c) Conclusions based on this observational study aresuspect since participation in the aquatic programmay be confounded with other lifestyle behaviors thatmay cause the improvement in lower back health.d) Conclusions based on this observational study aresuspect since a sample size of 35 is too small.e) This study is not an observational study since theaquatic program is a treatment.arrow_forwardA heart study objective was to study heart disease among healthy volunteers.After a 10-year follow-up period involving men aged 40 to 59, there were 16 casesof coronary heart disease (CHD) among the 454 men who initially had cholesterollevels below 210 mg/100 ml (referred to as the low serum cholesterol group). Incontrast, among the 424 men whose initial cholesterol levels were at least 245mg/100 ml (referred to as the high serum cholesterol group), there were 51 cases ofCHD. With this information, Draw a 2x2 contingency table then calculate the relative risk (RR) associated with high serum cholesterol and provide an interpretation of the result.arrow_forward
- in a school , 202 out of the 5900 children had developed lung disease.it was also found that children who were active ( burnig about 3500 caloeries daily ) were a third likely to develop lung disease as compared with children who were following a sedentary lifestyle . assume that 1 in 20 children is very active , and the rest are classified as sedentary find the prob that a child with lung disease is very activearrow_forward2. A psychologist at a private mental hospital was asked to determine whether there was a clear difference in the length of stay for patients with different categories of diagnosis. Looking at the last four patients in each of the three major categories, the results (in terms of weeks of stay) were as follows: Diagnosis Category Affective Disorders Cognitive Disorders Drug-Related Conditions 7 12 8 6 8 10 5 9 12 6 11 10 Using alpha = 0.05, is there a…arrow_forwardRandom samples of 900 people in the United States and in Great Britain indicated that 60% of the people in the United States were positive about the future economy, whereas 66% of the people in Great Britain were positive about the future economy. Does this provide strong evidence that the people in Great Britain are more optimistic about the economy (alpha = 0,01)?arrow_forward
- A psychologist at a private mental hospital was asked to determine whether there was a clear difference in the length of stay for patients with different categories of diagnosis. Looking at the last four patients in each of the three major categories, the results (in terms of weeks of stay) were as follows: Diagnosis Category Affective Disorders Cognitive Disorders Drug-Related Conditions 7 12 8 6 8 10 5 9 12 6 11 10 Using alpha = 0.05, is there a significant difference in length of stay among diagnosis categories? Show all five steps of hypothesis testing. For additional practice, compute the means and standard deviations for each group. What is the purpose of a post hoc test? What does it tell us? Explain why we do not need a post hoc test if there are only two groups in our study. Conduct Tukey's HSD post hoc test to determine where there is a difference in the three groups.arrow_forwardA psychologist at a private mental hospital was asked to determine whether there was a clear difference in the length of stay for patients with different categories of diagnosis. Looking at the last four patients in each of the three major categories, the results (in terms of weeks of stay) were as follows: Diagnosis Category Affective Disorders Cognitive Disorders Drug-Related Conditions 7 12 8 6 8 10 5 9 12 6 11 10 Using alpha = 0.05, is there a significant difference in length of stay among diagnosis categories? Show all five steps of hypothesis testing and compute the means and standard deviations for each group.arrow_forwardA travel association says the daily lodging costs for a family in the United States is $132. You work for a tourist publication and want to test this claim. You randomly selected 10 U.S. families and find out how much each spent on lodging for one overnight trip. At alpha=0.02, can you reject the travel association's claim? (Adapted from the American Automobile Association) 164 137 142 155 119 104 74 204 148 181 Assume the population is normally distributed.arrow_forward
 Holt Mcdougal Larson Pre-algebra: Student Edition...AlgebraISBN:9780547587776Author:HOLT MCDOUGALPublisher:HOLT MCDOUGAL
 Algebra & Trigonometry with Analytic GeometryAlgebraISBN:9781133382119Author:SwokowskiPublisher:Cengage