
Concept explainers
Videos
Sea Temperature To predict the effect of El Niño or La Niña events in the future, the National Oceanographic and Atmospheric Administration collects information about sea surface temperature (SST) and atmospheric conditions. They compare monthly temperature averages in the eastern equatorial Pacific Ocean to historical data and calculate the difference (the degree of anomaly) to determine if El Niño conditions, La Niña conditions, or neutral conditions are developing. El Niño is a rise in the average SST above 0.5°C. A decline of the same amount is La Niña. FIGURE 47.8 shows data for 42 years.
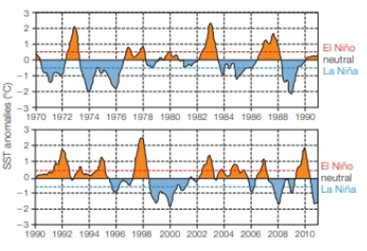
FIGURE 47.8 Sea surface temperature anomalies (difference from the historical mean) in the eastern equatorial Pacific Ocean. A rise above the dashed red line is an El Niño event, a decline below the blue line is La Niña
What type or conditions were in effect in the fall of 2007 when California suffered severe wildfires?
Want to see the full answer?
Check out a sample textbook solution
Chapter 47 Solutions
Biology: The Unity and Diversity of Life


- Climate is the result of a variety of global processes. What of the following is a climatological driver? rotation of Earth hydrosphere properties oceanic currents concertation of sun irradiances all of the abovearrow_forwardPredictions of hydroclimatic change with global warming suggest that precipitation events are becoming/will become more extreme. In other words, heavy/flooding precipitation events will occur with greater frequency. Explain how the capacity of Earth’s atmosphere to hold water vapor changes as the atmosphere warms, such that heavier precipitation events could be triggered.arrow_forwardWhich of the following statements about atmospheric carbon dioxide levels is correct? For about 800,000 years prior to human influence it varied between 180 and 300 ppm and is now above 410 ppm. For about 800,000 years prior to human influence it never exceeded 200 ppm. Its rate of increase in the past century is greater than any seen in the ice core record. Both 1 & 3arrow_forward
- There is growing support for the idea that as we warm the planet and spread fresh water over the North Atlantic from melting polar ice caps in the Arctic, we will slow down the conveyor belt circulation. What might happen to temperatures at: High Latitudes: At Mid and Low Latitudes:arrow_forwardWhich of the following statements explains why temperature is considered a reliable metric to investigate climate change? Select all that apply: a. changes in other aspects of climate, such as precipitation or sea level, are a response to the temperature change b. there is a long-term global database for temperature c. temperature has been measured directly for millennia d. global temperature measurements include weather variabilityarrow_forwardAlabama isn't a desert! Yet, it is at the same latitude as most major deserts in the Northern Hemisphere. What major feature on the earth is responsible for Alabama's humid climate? Group of answer choices hadley cells tradewinds ocean gyres ground waterarrow_forward
- Select the correct terms: (Climate / Weather) is the short-term atmospheric conditions in an area, while (climate / weather) is the average atmospheric conditions in a given area over a long period of time. (Climate change / Global warming) consists of the long-term and largescale changes in atmospheric conditions, which have been brought about by (climate change / global warming), an increase in the average global temperature.arrow_forwardHuman lifestyle choices currently release greenhouse gases into the atmosphere at higher rates than what occurs naturally. When greenhouse gases like carbon dioxide, methane, and nitrous oxide accumulate they trap heat. As a result of this trapped heat, temperatures on Earth's surface are changing Figure 1 - Greenhouse Gas Emissions by Humans Choice and the Greenhouse Gases Emitted as a Result Which of these ideas would be the best course of action for decreasing land temperatures? 1. Phase-out agricultural production, since that sector, produces the largest amounts of methane and nitrous oxide. 2. Decrease land use and biomass burning, because this sector produces all three major greenhouse gases. 3. increase the number of waste disposal and treatment plants because they do not release carbon dioxide 4. Develop alternative energy sources to decrease the amount of carbon dioxide released as a result of power stationsarrow_forwardThe warming trends discussed in the Case Study are most pronounced at the equator, where sunlight is most direct. What would you predict the effect of global warming to be nearer the poles, where temperatures are lower and there is less sunlight?arrow_forward
- Which of the following events best explains the annual saw tooth pattern that is seen in the Keeling Curve (atmospheric CO2 abundance)? a. oceanic diel vertical migrations b. photosynthesis and respiration c. annual sea ice melting and refreezing d. southern hemisphere seasonal variationarrow_forwardGlobal warming is dependent on the incoming rate of solar radiation as against the absorption of heat inside the earth. . true or falsearrow_forwardWhich of the climate change factors listed below is NOT caused by warming temperatures? A. Higher frequency of category 6 hurricanes B. Rising sea levels C. Ocean acidification D. Melting glaciers and ice sheetsarrow_forward
 Biology: The Unity and Diversity of Life (MindTap...BiologyISBN:9781337408332Author:Cecie Starr, Ralph Taggart, Christine Evers, Lisa StarrPublisher:Cengage Learning
 Biology: The Unity and Diversity of Life (MindTap...BiologyISBN:9781305073951Author:Cecie Starr, Ralph Taggart, Christine Evers, Lisa StarrPublisher:Cengage Learning
 Biology Today and Tomorrow without Physiology (Mi...BiologyISBN:9781305117396Author:Cecie Starr, Christine Evers, Lisa StarrPublisher:Cengage Learning
 Biology: The Dynamic Science (MindTap Course List)BiologyISBN:9781305389892Author:Peter J. Russell, Paul E. Hertz, Beverly McMillanPublisher:Cengage Learning