
Concept explainers
(a)
To calculate the total surplus, when the demand curve is D1.
Explanation of Solution
The market
The demand curve D1 and the supply curve intersect at the point, where the market price is $14.
The total surplus is divided into two parts:
The consumer surplus is represented by the area above the price line and below the demand curve, while the producer surplus is represented by the area under the price line and above the supply curve.
The consumer surplus and producer surplus are shown below:
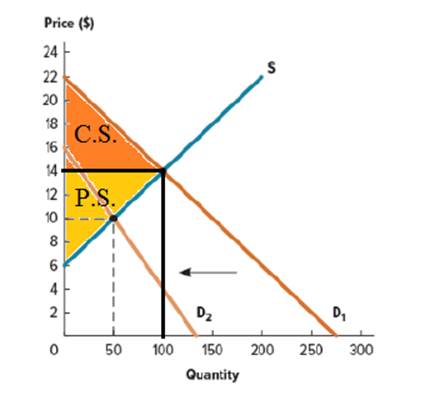
The consumer surplus is calculated as follows:
The producer surplus is calculated as follows:
(b)
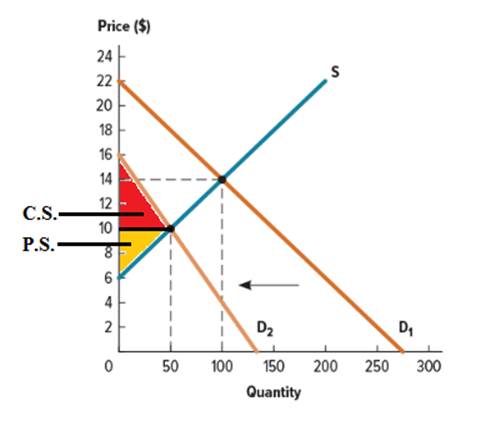
To calculate the total surplus, when the demand curve is D2.
Explanation of Solution
The market price at equilibrium is calculated by the intersection of the demand curve and the supply curve.
The demand curve D2 and the supply curve intersect at the point where the market price is $10.
The consumer surplus and producer surplus is shown below:
Want to see more full solutions like this?
Chapter 5 Solutions
Microeconomics


- The demand equation for a particular candy bar is px + x + 20p = 3000 where 1000x candy bars are demanded per week when p cents is the price per bar. If the current price of the candy is 49 cents per bar and the price per bar is increasing at the rate of 0.2 cents each week, find the rate of change in the demand.arrow_forwardIn the below figure, a consumer is initially in equilibrium at point C. The consumer’s income is $250, and the budget line through point C is given by $250 = $50X + $125Y. When the consumer is given a $100 gift certificate that is good only at store X, she moves to a new equilibrium at point D. "The horizontal axis is labeled Product X. The vertical axis is labeled Product Y. A line begins at point A on the vertical axis goes down to the right and ends at point E on the horizontal axis. A second line parallel to the first one begins at point B in the first quadrant close to point A, goes down to the right and ends at point F on the horizontal axis. A horizontal line connects point A and B. An upward-facing curve labeled l-subscript 1 begins at the top left of the quadrant along the vertical axis, goes down to the right in decreasing steepness, intersects the horizontal line [AB], meets the first line at point C then continues with increasing to the right and above the line to exit…arrow_forwardDiscuss The intrinsic value of goods among the physiocrats.arrow_forward
- Scenario Between recalls on mass-produced commercial dog food and a general understanding of the benefits of a healthier diet for pets, the demand for natural or organic dog food is experiencing a significant increase. Wanda's treats are more expensive than the mass-produced treats found in most grocery and big box stores, but she prides herself on providing high-quality products and believes that her customers are willing to pay the extra money for quality. 1. How does Wanda's strategy of being a high-quality provider take advantage of the shifts in consumer demand for healthy dog treats? 2. Identify and describe an event that might occur in the economy that would cause Wanda's strategy to no longer be successful for Salty Pawz. If this event occurred, What actions would Wanda have to take in response, and what impact might they have on her business?arrow_forwardAs you now know, we are considering entering the tomato sauce market. We have continued our research and now better understand consumer demand for our jars of sauce as: D(p) = -3p+25 We are prepared to supply: S(p) = 2p-4 In this question, assume that the equilibrium price and quantity are given by: P∗ and Q∗ What is the consumer's surplus at $4?arrow_forward1.5 Your firm, Content Friend, is similar to Happy Labourer, a Ghanaian firm that designs and manufactures artifacts and souvenirs. Your research analyst has estimated the demand function for your kente souvenirs is Qd = 33 - 4P If you set the price of a plush kente souvenir at $5, how many will consumers buy? If you increase the price of a plush kente souvenir by $1, how will this change the quantity that your customers buy?arrow_forward
- Refer to Table 11W.1 and suppose the price of new product C is $2 instead of $4. How does this affect the optimal combination of products A, B, and C for the person represented by the data? Explain: “The success of a new product depends not only on its marginal utility but also on its price.”arrow_forwardAhmed is an agent for Bader for maintaining Bader’s antique cars collection, including sale and purchase of antique cars. Ahmed has had this position for several years, but recently Ahmedhas developed a cocaine habit. He recently sold one of Bader’s cars and kept some of the money himself to buy some cocaine. Soon thereafter, Ahmed was declared bankrupt. The government then notified Ahmed that he had sold the maximum allowable number of cars in a year without getting a dealer’s license. Shortly thereafter, Bader was on a secluded island and died, which no one knew about until 2 weeks later. Discuss the effect of these events on the existence of the agency.arrow_forwardEarlier this year, 2021, the price of chicken meat rose unexpectedly reached to 250/ kilo at peak from the previous price of 170/ kilo. This 68% increase of price per kilo was primarily caused by excess demand for chicken meat. This is the result of the decrease in consumption for pork meat due to the threat of African Swine Flu (ASF). However, even though consumer shifted preferences, the increase in the price of chicken was perceived to be too high for the budget of consumers. Therefore, sellers realized decrease in their daily aggregate sales from 1,000 kilos to 700 kilos. 1. Illustrate the change in the market equilibrium through a graph. 2. What presumably happened to the total revenues of the sellers during the price hike period? a.) Compute the price elasticity of demand b.) Derive the total revenue before the hike (TR1), and after the hike (TR2).arrow_forward
- Earlier this year, 2021, the price of chicken meat rose unexpectedly reached to 250/ kilo at peak from the previous price of 170/ kilo. This 68% increase of price per kilo was primarily caused by excess demand for chicken meat. This is the result of the decrease in consumption for pork meat due to the threat of African Swine Flu (ASF). However, even though consumer shifted preferences, the increase in the price of chicken was perceived to be too high for the budget of consumers. Therefore, sellers realized decrease in their daily aggregate sales from 1,000 kilos to 700 kilos. Illustrate the change in the market equilibrium through a graph. What presumably happened to the total revenues of the sellers during the = price hike period? Compute the price elasticity of demand. Derive the total revenue before the hike (TR1), and after the hike (TR2).arrow_forwardThe Brady family have a weekly budget of €200 to be spent on Food (F) and Other Goods (OG), which are initially equally priced at €10 and €20 per unit, respectively. Given recent inflation, the government has concerns about the ability of large families to afford an adequate diet for children. Due to this, the government announces that when Food consumption exceeds 12 units, the government will subsidise food consumption so that the price per subsequent unit will be €5 for any family. With Food on the horizontal axis, show the family’s pre and post-scheme budget line. Can we definitively determine the family’s utility maximising consumption bundle as a result of the government scheme?arrow_forwardUpon graduating from UT this May, you take on a management position working at UtMax theater. You will consider the utility of seeing performance over 1 month, and suppose that at a regular price of $$$ per ticket (my assigned ticket price is 145), customers will see no performance, however with the price reduced by $5, customers will see one performance per month and when reduced by $10, customers will see two performances. As long as the number performances, x, is small, your demand function for performance can be modeled by p=D(x). Write down your demand function.arrow_forward
 Managerial Economics: A Problem Solving ApproachEconomicsISBN:9781337106665Author:Luke M. Froeb, Brian T. McCann, Michael R. Ward, Mike ShorPublisher:Cengage Learning