Videos
To graph: The given inequality
Explanation of Solution
Given:
The inequality is
Procedure used:
To graph the linear inequality use the following steps.
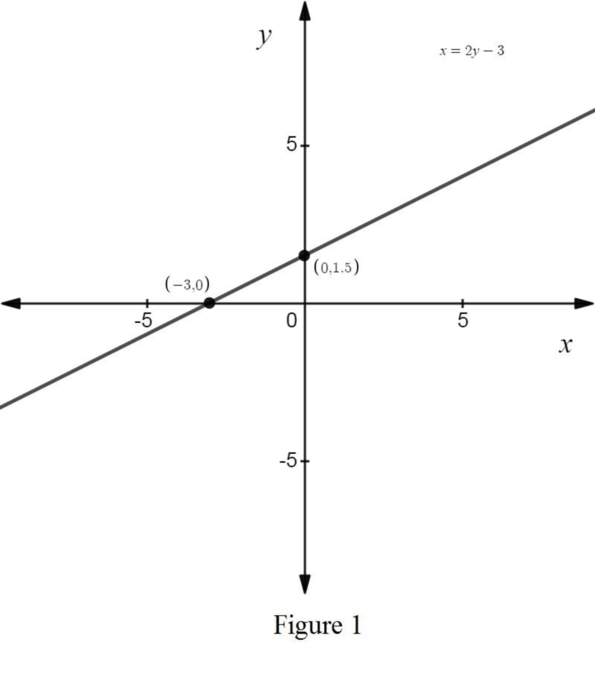
Step1: First graph
Step2: Choose a test point anywhere in the plane not on the line [the origin
Step3: Does the test point satisfy the original inequality. If so, shade the half plane that contain the test point. if not, shade the opposite half plane.
Graph:
Steps involved to graph of inequality
Step1: First draw the graph of the equation
Step 2: Choose the test point above or below the line. Let’s take
The statement is true. So
Step 3: Hence the graph of the solution set of the inequality
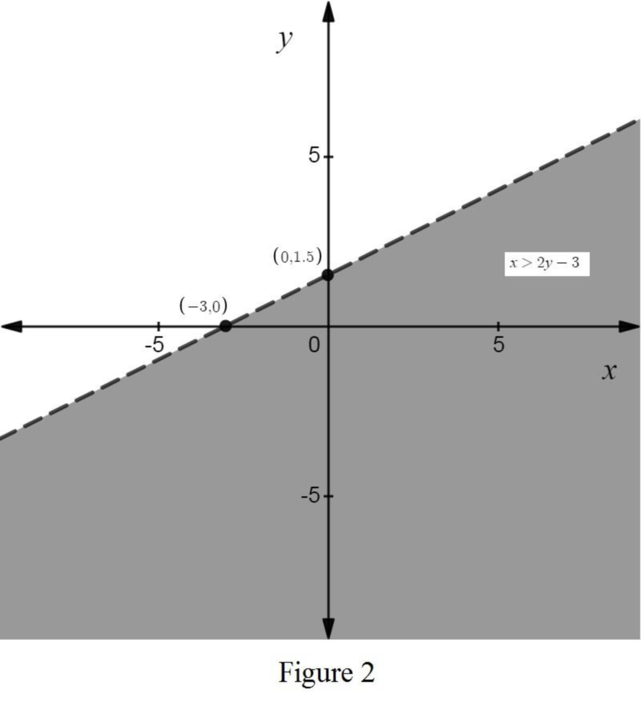
It is observed that the solution set contain origin and the solution set is the shaded region excluding boundary line.
Want to see more full solutions like this?
Chapter 5 Solutions
College Mathematics for Business, Economics, Life Sciences, and Social Sciences (14th Edition)


 Discrete Mathematics and Its Applications ( 8th I...MathISBN:9781259676512Author:Kenneth H RosenPublisher:McGraw-Hill Education
 Mathematics for Elementary Teachers with Activiti...MathISBN:9780134392790Author:Beckmann, SybillaPublisher:PEARSON
 Thinking Mathematically (7th Edition)MathISBN:9780134683713Author:Robert F. BlitzerPublisher:PEARSON
 Discrete Mathematics With ApplicationsMathISBN:9781337694193Author:EPP, Susanna S.Publisher:Cengage Learning,
 Pathways To Math Literacy (looseleaf)MathISBN:9781259985607Author:David Sobecki Professor, Brian A. MercerPublisher:McGraw-Hill Education