
Introduction To Statistics And Data Analysis
6th Edition
ISBN: 9781337793612
Author: PECK, Roxy.
Publisher: Cengage Learning,
expand_more
expand_more
format_list_bulleted
Concept explainers
Videos
Textbook Question
Chapter 5, Problem 69CR
The paper “A Cross-National Relationship Between Sugar Consumption and Major Depression?” (Depression and Anxiety [2002]: 118–120) concluded that there was a
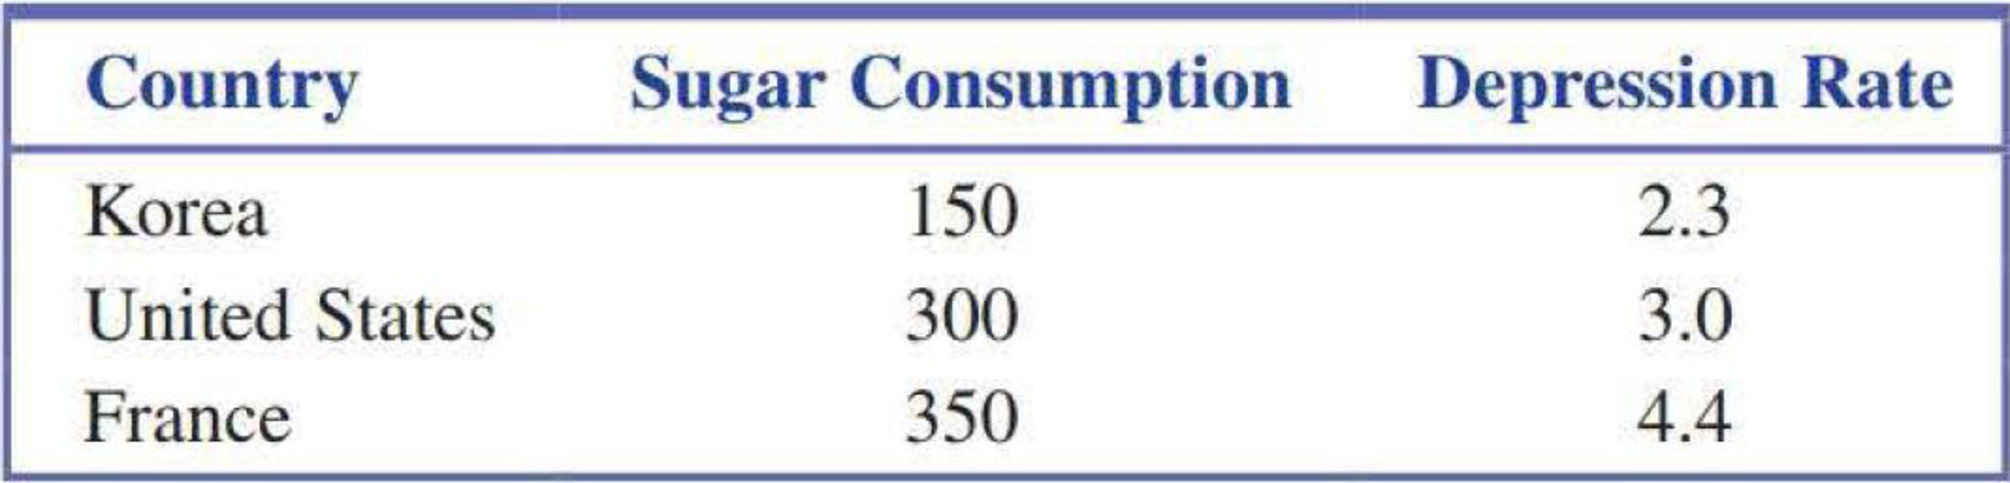
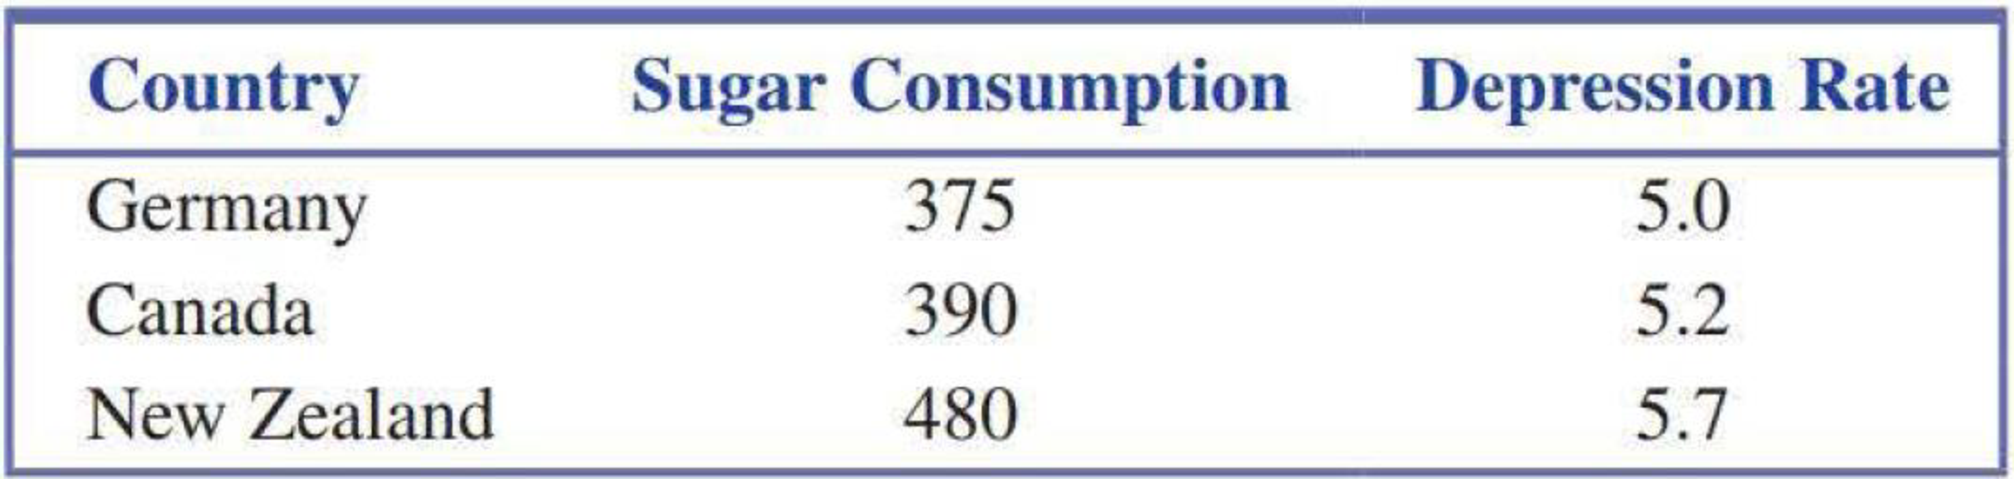
- a. Calculate and interpret the
correlation coefficient for this data set. - b. Is it reasonable to conclude that increasing sugar consumption leads to higher rates of depression? Explain.
- c. Do you have any concerns about this study that would make you hesitant to generalize these conclusions to other countries?
Expert Solution & Answer

Trending nowThis is a popular solution!

Students have asked these similar questions
A. For which data set is the sample correlation coefficient r closest to 0?
B. Which data set has an apparent negative, but not perfect, linear relationship between its two variables?
The following table gives information on the amount of sugar (in grams) and the calorie count in one serving of a sample of 13 different varieties of cereal.
Sugar (gms)
4
15
12
11
8
6
7
2
7
14
20
3
13
Calories
120
200
140
110
120
80
190
100
120
190
190
110
120
(a) Find the correlation coefficient and coefficient of determination. What can you conclude from their values?
(b) Test at a 1% significance level whether the linear correlation coefficient between the two variables listed in the table is positive. Use both the p-value and critical value (including reject and non-reject regions) approaches
Consider that in a retrospective cohort study involving job type and heart disease among railroad workers, the following data was obtained.
heart disease
job type yes no
clerk 50 500
track worker 22 390
calculate the association between the two variables - The first is the covariance, and the second is the correlation coefficient.
Chapter 5 Solutions
Introduction To Statistics And Data Analysis
Ch. 5.1 - For each of the scatterplots shown, answer the...Ch. 5.1 - For each of the following pairs of variables,...Ch. 5.1 - For each of the following pairs of variables,...Ch. 5.1 - For each of the following pairs of variables,...Ch. 5.1 - Is the following statement correct? Explain why or...Ch. 5.1 - Draw a scatterplot for which r = 1.Ch. 5.1 - Draw a scatterplot for which r = 1.Ch. 5.1 - Each year J.D. Power and Associates surveys new...Ch. 5.1 - The accompanying data are x = Cost (cents per...Ch. 5.1 - The authors of the paper Flat-footedness Is Not a...
Ch. 5.1 - The paper The Relationship Between Cell Phone Use,...Ch. 5.1 - Data from the U.S. Federal Reserve Board (federal...Ch. 5.1 - The article 115K! The 13 Best Paying U.S....Ch. 5.1 - It may seem odd, but one of the ways biologists...Ch. 5.1 - An auction house released a list of 25 recently...Ch. 5.1 - A sample of automobiles traversing a certain...Ch. 5.2 - Two scatterplots are shown below. Explain why it...Ch. 5.2 - The authors of the paper Statistical Methods for...Ch. 5.2 - The accompanying data are a subset of data from...Ch. 5.2 - The authors of the paper Evaluating Existing...Ch. 5.2 - The authors of the paper referenced in the...Ch. 5.2 - A sample of 548 ethnically diverse students from...Ch. 5.2 - The relationship between hospital patient-to-nurse...Ch. 5.2 - The report Airline Quality Rating 2016...Ch. 5.2 - Acrylamide is a chemical that is sometimes found...Ch. 5.2 - Use the acrylamide data given in the previous...Ch. 5.2 - Studies have shown that people who suffer sudden...Ch. 5.2 - The data given in the previous exercise on x =...Ch. 5.2 - An article on the cost of housing in Califomia...Ch. 5.2 - The following data on sale price, size, and...Ch. 5.2 - Explain why it can be dangerous to use the...Ch. 5.2 - The sales manager of a large company selected a...Ch. 5.2 - Explain why the slope b of the least-squares line...Ch. 5.2 - Prob. 34ECh. 5.3 - Does it pay to stay in school? The report Trends...Ch. 5.3 - The data in the accompanying table is from the...Ch. 5.3 - The paper referenced in the previous exercise also...Ch. 5.3 - Consider the residual plot from the previous...Ch. 5.3 - The report Airline Quality Rating 2016...Ch. 5.3 - Acrylamide is a chemical that is sometimes found...Ch. 5.3 - Consider the scatterplot of acrylamide...Ch. 5.3 - Some types of algae have the potential to cause...Ch. 5.3 - The relationship between x = Total number of...Ch. 5.3 - The residuals from the least-squares line for the...Ch. 5.3 - The first Batman movie was made over 50 years ago...Ch. 5.3 - The article 115K! The 13 Best Paying U.S....Ch. 5.3 - The article Examined Life: What Stanley H. Kaplan...Ch. 5.3 - The accompanying data are a subset of data from...Ch. 5.3 - The article California State Parks Closure List...Ch. 5.3 - The article referenced in the previous exercise...Ch. 5.3 - A study was carried out to investigate the...Ch. 5.3 - Both r2 and se are used to assess the fit of a...Ch. 5.3 - Prob. 53ECh. 5.4 - The following data on x = Frying time (in seconds)...Ch. 5.4 - Use the information provided in the previous...Ch. 5.4 - The paper Aspects of Food Finding by Wintering...Ch. 5.4 - Food intake of grazing animals is limited by the...Ch. 5.4 - A study, described in the paper Prediction of...Ch. 5.4 - Prob. 59ECh. 5.4 - The following table gives the number of heart...Ch. 5.4 - Refer to the heart transplant data given in the...Ch. 5.4 - The paper Population Pressure and Agricultural...Ch. 5.4 - Determining the age of an animal can sometimes be...Ch. 5.5 - The paper How Lead Exposure Relates to Temporal...Ch. 5.5 - The following quote is from the paper Evaluation...Ch. 5 - The accompanying data represent x = Amount of...Ch. 5 - The paper A Cross-National Relationship Between...Ch. 5 - The following data on x = Score on a measure of...Ch. 5 - The paper Effects of Canine Parvovirus (CPV) on...Ch. 5 - The paper Depression, Body Mass Index, and Chronic...Ch. 5 - The paper Aspects of Food Finding by Wintering...Ch. 5 - Data on salmon availability (x) and the percentage...Ch. 5 - No tortilla chip lover likes soggy chips, so it is...Ch. 5 - The article Reduction is Soluble Protein and...Ch. 5 - The following quote is from the paper The Weight...Ch. 5 - An accurate assessment of oxygen consumption...Ch. 5 - Consider the four (x, y) pairs (0, 0), (1, 1), 1,...Ch. 5 - Prob. 1CRECh. 5 - Data from a survey of 1046 adults age 50 and older...Ch. 5 - Prob. 3CRECh. 5 - Prob. 4CRECh. 5 - Prob. 5CRECh. 5 - The amount of money spent each year on science,...Ch. 5 - Below are the data used to construct the time...Ch. 5 - In August 2009, Harris Interactive released the...Ch. 5 - Prob. 9CRECh. 5 - Prob. 10CRECh. 5 - Prob. 11CRECh. 5 - Prob. 12CRECh. 5 - Cost-to-charge ratios (the percentage of the...Ch. 5 - In the article Reproductive Biology of the Aquatic...Ch. 5 - Prob. 15CRECh. 5 - Anabolic steroid abuse has been increasing despite...Ch. 5 - Prob. 81ECh. 5 - Prob. 82ECh. 5 - Prob. 83ECh. 5 - Prob. 84ECh. 5 - Suppose the hypothetical data below are from a...Ch. 5 - Prob. 86E
Additional Math Textbook Solutions
Find more solutions based on key concepts
Compare and contrast the nonscientific methods for knowing or acquiring knowledge (tenacity, intuition, authori...
Research Methods for the Behavioral Sciences (MindTap Course List)
Alvie Singer lives at 0 in the accompanying diagram and has four friends who live at A, B, C, and D. One day Al...
Probability and Statistics for Engineering and the Sciences
In Exercises 5-36, express all probabilities as fractions.
23. Combination Lock The typical combination lock us...
Essentials of Statistics, Books a la Carte Edition (5th Edition)
Find how many SDs above the mean price would be predicted to cost.
Intro Stats, Books a la Carte Edition (5th Edition)
(a) For each data set, find the mean, median, and mode. (b) Discuss anything about the data that affects the us...
APPLIED STAT.IN BUS.+ECONOMICS
Knowledge Booster


Learn more about
Need a deep-dive on the concept behind this application? Look no further. Learn more about this topic, statistics and related others by exploring similar questions and additional content below.Similar questions
- Listed below are numbers of Internet users per 100 people and numbers of scientific award winners per 10 million people for different countries. Construct a scatterplot, find the value of the linear correlation coefficient r, and find the P-value of r. Determine whether there is sufficient evidence to support a claim of linear correlation between the two variables. Use a significance level of α=0.01. Internet Users 80.1 78.2 56.5 66.8 77.2 38.6 Award Winners 5.4 9.3 3.2 1.7 10.5 0.1 The linear correlation coefficient is r=arrow_forwardA researcher wants to determine if the number of years of education for a parent correlates with the number of years of education for their child. The table shows the number of years of education of the parent and the number of years of education of their child for a random sample of 7. Years of Education of Parent 13 9 12 10 12 10 12 Years of Educations of their Child 15 11 10 16 17 12 17 Conduct a hypothesis test to determine if there is a significant linear correlation between the two variables. Use α = 0.05. What is the test statistic for this hypothesis test? A researcher wants to determine if the number of years of education for a parent correlates with the number of years of education for their child. The table shows the number of years of education of the parent and the number of years of education of their child for a random sample of 7. Years of Education of Parent 13 9 12 10 12 10 12 Years of Educations of their Child 15 11 10 16 17 12 17…arrow_forwardA researcher wants to determine if the number of years of education for a parent correlates with the number of years of education for their child. The table shows the number of years of education of the parent and the number of years of education of their child for a random sample of 7. Years of Education of Parent 13 9 12 10 12 10 12 Years of Educations of their Child 15 11 10 16 17 12 17 Conduct a hypothesis test to determine if there is a significant linear correlation between the two variables. Use α = 0.05. What is the p-value for this hypothesis test? 0.9378 0.3914 0.1496 0.3867arrow_forward
- A researcher wants to determine if the number of years of education for a parent correlates with the number of years of education for their child. The table shows the number of years of education of the parent and the number of years of education of their child for a random sample of 7. Years of Education of Parent 13 9 12 10 12 10 12 Years of Educations of their Child 15 11 10 16 17 12 17 Conduct a hypothesis test to determine if there is a significant linear correlation between the two variables. Use α = 0.05. What is the decision for this hypothesis test? Reject the null because the absolute value of the test statistic is greater than the critical value and the p-value is less than alpha. Fail to reject the null because the absolute value of the test statistic is less than the critical value and the p-value is greater than alpha. Reject the null because the absolute value of the test statistic is less than the critical value and the p-value is greater than alpha.…arrow_forwardListed below are numbers of Internet users per 100 people and numbers of scientific award winners per 10 million people for different countries. Construct a scatterplot, find the value of the linear correlation coefficient r, and find the P-value of r. Determine whether there is sufficient evidence to support a claim of linear correlation between the two variables. Use a significance level of α=0.01. Internet Users 78.1 80.6 56.3 66.2 77.1 38.5 Award Winners 5.7 8.9 3.4 1.7 10.6 0.1arrow_forwardListed below are numbers of Internet users per 100 people and numbers of scientific award winners per 10 million people for different countries. Construct a scatterplot, find the value of the linear correlation coefficient r, and find the P-value of r. Determine whether there is sufficient evidence to support a claim of linear correlation between the two variables. Use a significance level of α=0.01. Internet Users (Per 100) Award Winners (Per 10 Million)80.6 5.478.1 8.956.5 3.368.3 1.678.9 10.938.8 0.1 C The linear correlation coefficient is r=__ (round to three decimal places as needed) =0/=0 The test statistic is t= __ (Round to two decimal places as needed.) The P-value is __ (round to three decimal places as needed) Because the P-value of the linear correlation coefficient is (less than or…arrow_forward
arrow_back_ios
arrow_forward_ios
Recommended textbooks for you
 Glencoe Algebra 1, Student Edition, 9780079039897...AlgebraISBN:9780079039897Author:CarterPublisher:McGraw Hill
Glencoe Algebra 1, Student Edition, 9780079039897...
Algebra
ISBN:9780079039897
Author:Carter
Publisher:McGraw Hill
Correlation Vs Regression: Difference Between them with definition & Comparison Chart; Author: Key Differences;https://www.youtube.com/watch?v=Ou2QGSJVd0U;License: Standard YouTube License, CC-BY
Correlation and Regression: Concepts with Illustrative examples; Author: LEARN & APPLY : Lean and Six Sigma;https://www.youtube.com/watch?v=xTpHD5WLuoA;License: Standard YouTube License, CC-BY