In someone infected with measles, the virus level N (measured in number of infected cells per mL of blood plasma) reaches a peak density at about t = 12 days (when a rash appears) and then decreases fairly rapidly as a result of immune response. The area under the graph of N(t) from t = 0 to t = 12 (as shown in the figure) is equal to the total amount of infection needed to develop symptoms (measured in density of infected cells × time). The function N has been modeled by the function f(t) = −t(t − 21)(t + 1). Use this model with six subintervals and their midpoints to estimate the total amount of infection needed to develop symptoms of measles.
In someone infected with measles, the virus level N (measured in number of infected cells per mL of blood plasma) reaches a peak density at about t = 12 days (when a rash appears) and then decreases fairly rapidly as a result of immune response. The area under the graph of N(t) from t = 0 to t = 12 (as shown in the figure) is equal to the total amount of infection needed to develop symptoms (measured in density of infected cells × time). The function N has been modeled by the function f(t) = −t(t − 21)(t + 1). Use this model with six subintervals and their midpoints to estimate the total amount of infection needed to develop symptoms of measles.

Functions and Change: A Modeling Approach to College Algebra (MindTap Course List)
6th Edition
ISBN:9781337111348
Author:Bruce Crauder, Benny Evans, Alan Noell
Publisher:Bruce Crauder, Benny Evans, Alan Noell
Chapter1: Functions
Section1.1: Functions Given By Formulas
Problem 1TU: Explain the meaning of G(4,3,2) and calculate its value.

Related questions

Question
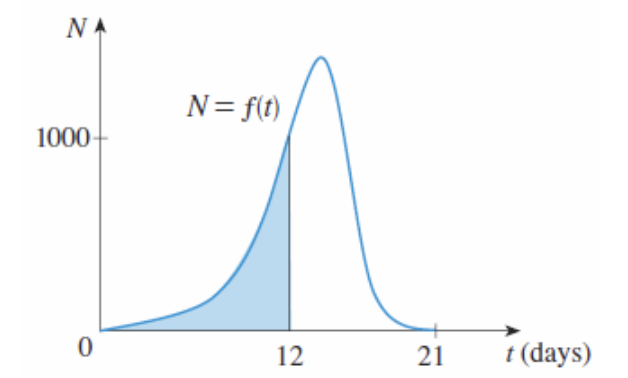
In someone infected with measles, the virus level N (measured in number of infected cells per mL of blood plasma) reaches a peak density at about
t = 12 days (when a rash appears) and then decreases fairly rapidly as a result of immune response. The area under the graph of N(t) from t = 0 to t = 12 (as shown in the figure) is equal to the total amount of infection needed to develop symptoms (measured in density of infected cells × time). The function N has been modeled by the function f(t) = −t(t − 21)(t + 1).
Use this model with six subintervals and their midpoints to estimate the total amount of infection needed to develop symptoms of measles.
Transcribed Image Text:NA
N= f(t)
1000-
12
21
t (days)
Expert Solution
This question has been solved!
Explore an expertly crafted, step-by-step solution for a thorough understanding of key concepts.

This is a popular solution!

Trending now
This is a popular solution!

Step by step
Solved in 2 steps

Knowledge Booster


Learn more about
Need a deep-dive on the concept behind this application? Look no further. Learn more about this topic, calculus and related others by exploring similar questions and additional content below.Recommended textbooks for you
Functions and Change: A Modeling Approach to Coll…
Algebra
ISBN:
9781337111348
Author:
Bruce Crauder, Benny Evans, Alan Noell
Publisher:
Cengage Learning

Algebra for College Students
Algebra
ISBN:
9781285195780
Author:
Jerome E. Kaufmann, Karen L. Schwitters
Publisher:
Cengage Learning

Intermediate Algebra
Algebra
ISBN:
9781285195728
Author:
Jerome E. Kaufmann, Karen L. Schwitters
Publisher:
Cengage Learning
Functions and Change: A Modeling Approach to Coll…
Algebra
ISBN:
9781337111348
Author:
Bruce Crauder, Benny Evans, Alan Noell
Publisher:
Cengage Learning
Algebra for College Students
Algebra
ISBN:
9781285195780
Author:
Jerome E. Kaufmann, Karen L. Schwitters
Publisher:
Cengage Learning
Intermediate Algebra
Algebra
ISBN:
9781285195728
Author:
Jerome E. Kaufmann, Karen L. Schwitters
Publisher:
Cengage Learning

Algebra: Structure And Method, Book 1
Algebra
ISBN:
9780395977224
Author:
Richard G. Brown, Mary P. Dolciani, Robert H. Sorgenfrey, William L. Cole
Publisher:
McDougal Littell


Algebra & Trigonometry with Analytic Geometry
Algebra
ISBN:
9781133382119
Author:
Swokowski
Publisher:
Cengage