
Concept explainers
Videos
Special Rounding instructions When you perform logistic regression, round the
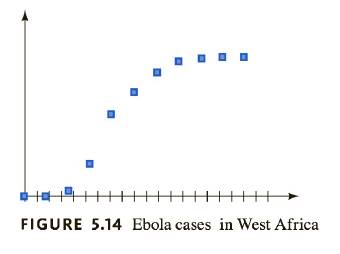
Ebola Figure
Where
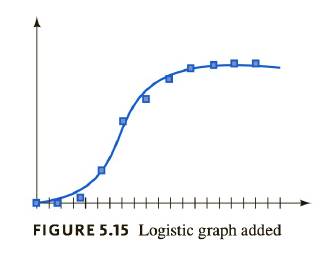
a. Does Figure
b. According to the model, what was the total number of cases when the disease was spreading at the fastest rate? Round your answer to the nearest whole number.
c. Use the crossing- graphs method to determine when the disease was growing at the fastest rate. Round your answer, in months, to one decimal place.
Want to see the full answer?
Check out a sample textbook solution
Chapter 5 Solutions
Functions and Change: A Modeling Approach to College Algebra (MindTap Course List)


- Special Rounding Instructions When you perform logistic regression, round the r value to three decimal places and the other parameters to two decimal places. Round all answers to two decimal places unless other-wise indicated. An Epidemic In a city of half a million, there are initially 800 cases of a particularly virulent strain of flu. The Centers for Disease Control and Prevention in Atlanta claims that the cumulative number of infections with this flu strain will increase by 40 per week if there are no limiting factors. Make a logistic model of the potential cumulative number of cases of flu as a function of weeks from initial outbreak, and determine how long it will be before 100, 000 people are infected.arrow_forwardSpecial Rounding Instructions When you perform logistic regression, round the r value to three decimal places and the other parameters to two decimal places. Round all answers to two decimal places unless other-wise indicated. PTA Participation A school board has a plan to increase participation in the PTA. Currently only about 25 parents attend meetings. Suppose the school board plan results in logistic growth of attendance. The school board believes that its plan can eventually lead to an attendance level of 50 parents. In the absence of limiting factors, the school board believes that its plan can increase participation by 10 each month. Let m denote the number of months since the participation plan was put in place, and let P be the number of parents attending PTA meetings. a. What is the carrying capacity K for a logistic model of P versus m? b. Find the constant b for a logistic model. c. Find the r value for a logistic model. Round your answer to three decimal places. d. Find a logistic model for P versus m.arrow_forwardSpecial Rounding Instructions When you perform logistic regression, round the r value to three decimal places and the other parameters to two decimal places. Round all answers to two decimal places unless other-wise indicated. Magazine Sales Our new magazine initially sells 300 copies per month. Research indicates that a vigorous advertising campaign could increase sales by 20 each month if our market were unlimited. But research also indicates that magazine sales in our area are unlikely to exceed 1200 per month. Make a logistic model of projected magazine sales.arrow_forward
- Special Rounding Instructions When you perform logistic regression, round the r value to three decimal places and the other parameters to two decimal places. Round all answers to two decimal places unless other-wise indicated. Fluorescent Bulbs Compact fluorescent light bulbs save energy when compared with traditional incandescent bulbs. Our green energy campaign includes efforts to get local residents to exchange their incandescent bulbs fur fluorescent bulbs. Initially 200 households make the change. Market studies suggest that, in the absence of limiting factors, we could increase that number by 25 each month. In our target area, there are 250,000 households, which we take as the limiting value. Make a logistic model that gives the number of households converting to fluorescent bulbs after t months.arrow_forwardSpecial Rounding Instructions When you perform logistic regression, round the r value to three decimal places and the other parameters to two decimal places. Round all answers to two decimal places unless other-wise indicated. Natural Gas Production The following table shows natural gas production N in trillions of cubic feet in the United states t years after 1940. t=yearssince1940 N=cubicft.intrilliions 0 3.75 10 8.48 20 15.09 30 23.79 40 21.87 50 21.52 60 24.15 a. Make a logistic model for N as a function of t. b. Graph the data and the logistic model. c. Which years production was farthest from the prediction of the logistic model? d. What does the logistic model predict for the amount of natural gas that will be produced in the long run? Note: In other contexts, this would be known as the carrying capacity..arrow_forwardSpecial Rounding Instructions When you perform logistic regression, round the r value to three decimal places and the other parameters to two decimal places. Round all answers to two decimal places unless other-wise indicated. African Bees There are 3600 commercial bee hives in a region threatened by African bees. Today African bees have taken over 50 hives. Experience in other areas shows that, in the absence of limiting factors, the African bees will increase the number of hives they take over by 30 each year. Make a logistic model that shows the number of hives taken over by African bees after t years, and determine how long it will be before 1800 hives are affected.arrow_forward
- Special Rounding Instructions When you perform logistic regression, round the r value to three decimal places and the other parameters to two decimal places. Round all answers to two decimal places unless otherwise indicated. Baseball Hall of Fame The number of lifetime home runs H for a Major League Baseball player is related to the probability P as a percent that he will be inducted into the Hall of Fame. A proposed relationship is P=1001+383.75e0.0143H. a.Plot the graph of P versus H. Include values on H-axis up to 700 home runs. b.Mickey Mantle had 536 career home runs. According to this model, what were his chances of getting into the Hall of Fame?Mickey Mantle is in the Hall of Fame. c.A Major League Baseball player hopes to make the Hall of Fame. Does a home run today have a greater effect on his chances if he currently has 400 or 500 career home runs.arrow_forwardSpecial Rounding Instructions When you perform logistic regression, round the r value to three decimal places and the other parameters to two decimal places. Round all answers to two decimal places unless otherwise indicated. An Inverted Logistic Curve When the parameter r in the logistic formula is negative resulting in a positive power of e, the logistic curve has a different shape. For example, the following formula gives the approximate number of deaths due to tuberculosis as a fraction of all deaths in the United States t years after 1875: T=0.131+0.07e0.05t a. Make a graph of T versus t. Include dates up to 2000. b. What is the limiting value of T? Explain in practical terms what this limiting value means. c. Estimate when the fraction of deaths due to tuberculosis was decreasing most rapidly. Give your answer accurate to the nearest decade e.g., 1920.arrow_forwardSpecial Rounding Instructions When you perform logistic regression, round the r value to three decimal places and the other parameters to two decimal places. Round all answers to two decimal places unless other-wise indicated. Mortality Versus Age. One study of morality versus age used the following model to give the probability P of death from measles It contracted at age t years: P=11+77.39e0.08t Here we assume that t is at least 2. a. What is the limiting value for this logistic function? Note: In other contexts, this would be known as the carrying capacity. b. Explain in practical terms the meaning of the limiting value you found in part a. c. At what age does the model predict that mortality due to measles is 70 ? That is a value of 0.7 for P.arrow_forward
- Special Rounding Instructions For this exercise set, round all regression parameters to three decimal places, but round all other answers to two decimal places unless otherwise indicated. Rare Coins The table below shows the estimated value C, in dollars, of an 1877 Indian Head Cent Philadelphia mint mark in very fine condition t years after 1950. t=time,inyearssince1950 C=value,indollars 0 25 30 400 45 625 54 1750 60 2000 a.Use exponential regression to model C as an exponential function of t. b.According to your exponential model, by what percentage does the value of the 1877 cent increase from year to year?arrow_forwardSpecial Rounding Instructions For this exercise set, round all regression parameters to three decimal places, but round all other answers to two decimal places unless otherwise indicated. Gray Wolves in WisconsinGray wolves were among the first mammals protected under the Endangered Species Act in the 1970s. Wolves recolonized in Wisconsin beginning in 1980.Their population grew reliably after 1985 as follows: Year Wolves Year Wolves 1985 15 1993 40 1986 16 1994 57 1987 18 1995 83 1988 28 1996 99 1989 31 1997 145 1990 34 1998 178 1991 40 1999 197 1992 45 2000 266 a. Explain why an exponential model may be appropriate. b. Are these data exactly exponential? Explain. c. Find an exponential model for these data. d. Plot the data and the exponential model. e. Comment on your graph in part d. Which data points are below or above the number predicted by the exponential model?arrow_forwardSpecial Rounding Instructions When you perform logistic regression, round the r value to three decimal places and the other parameters to two decimal places. Round all answers to two decimal places unless otherwise indicated. Multiple Myeloma is a cancer of the blood plasma cells. One study used a logistic function to model the number N, in billions, of cells in a myeloma tumor t days after the typical size at diagnosis: N=10001+999e0.0114t. a.Plot the graph of N versus t over the first 1200days. b.How long does it take the tumor to reach 100 times its size at the time of diagnosis?arrow_forward
 Functions and Change: A Modeling Approach to Coll...AlgebraISBN:9781337111348Author:Bruce Crauder, Benny Evans, Alan NoellPublisher:Cengage Learning