
Concept explainers
Videos
Consider the
- a. Which observation is potentially influential? Explain the reason for your choice.
- b. When the potentially influential observation is deleted from the data set, the equation of the least-squares line using the remaining five observations
5.40 Acrylamide is a chemical that is sometimes found in cooked starchy foods and which is thought to increase the risk of certain kinds of cancer. The paper “A Statistical Regression Model for the Estimation of Acrylamide Concentrations in French Fries for Excess Lifetime Cancer Risk Assessment” (Food and Chemical Toxicology [2012]: 3867–3876) describes a study to investigate the effect of x = Frying time (in seconds) and y = Acrylamide concentration (in micrograms per kilogram) in French fries. The data in the accompanying table are approximate values read from a graph that appeared in the paper.
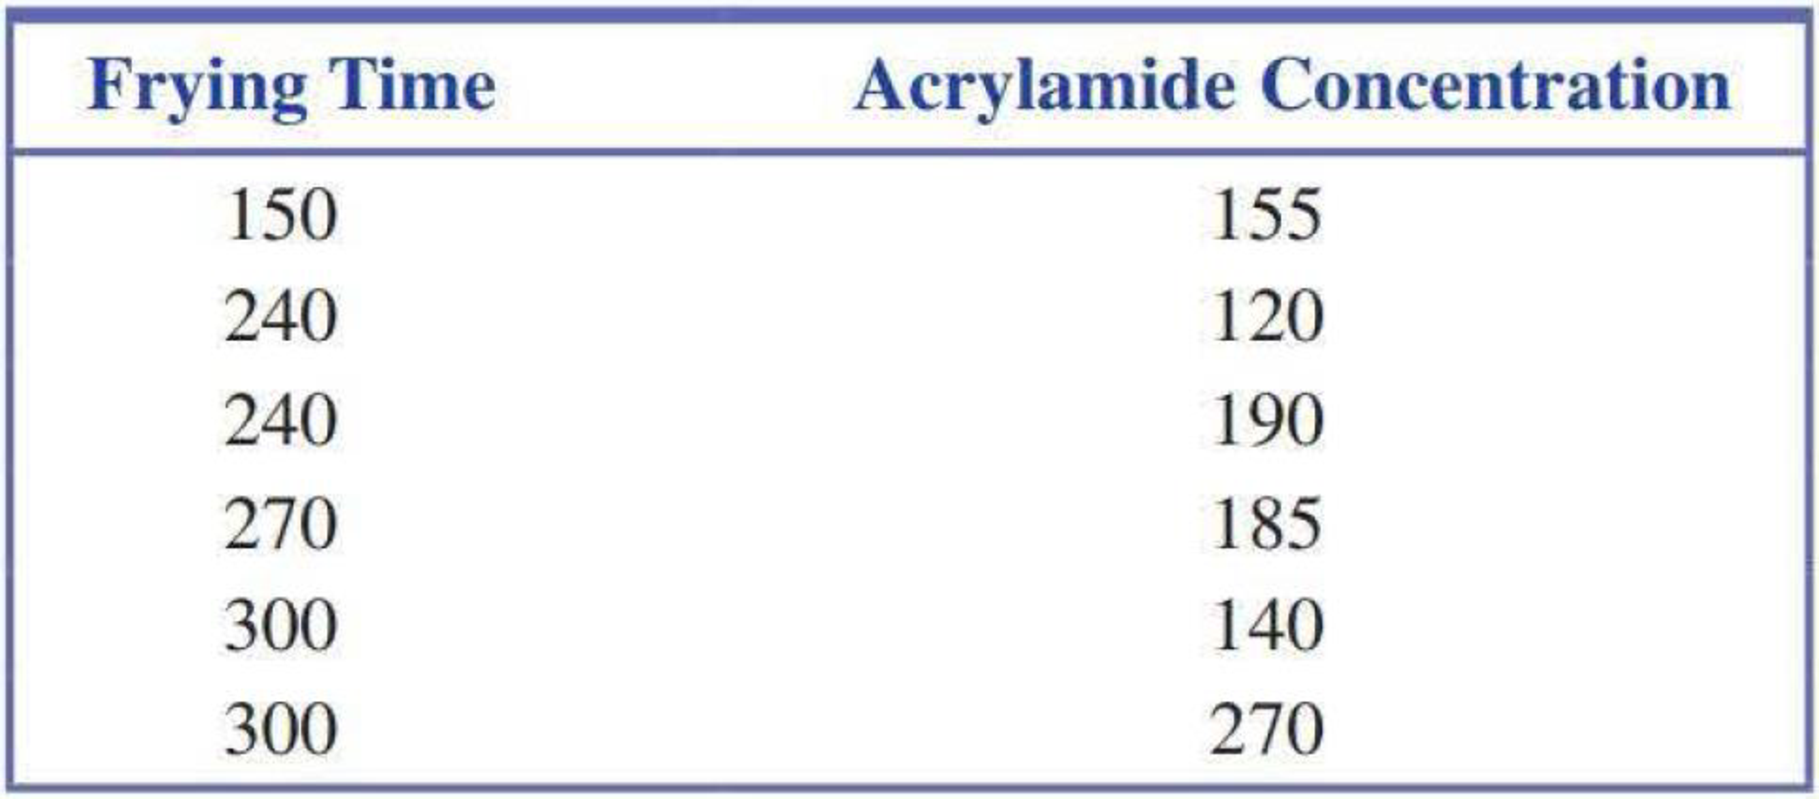
- a. Construct a scatterplot of these data.
- b. Find the equation of the least-squares line. Based on this line, what would you predict acrylamide concentration to be for a frying time of 270 seconds? What is the residual associated with the observation (270, 185)?
Want to see the full answer?
Check out a sample textbook solution
Chapter 5 Solutions
Introduction To Statistics And Data Analysis
Additional Math Textbook Solutions
Statistics for Business & Economics, Revised (MindTap Course List)
Elementary Statistics: A Step By Step Approach
APPLIED STAT.IN BUS.+ECONOMICS
Elementary Statistics
Probability and Statistics for Engineering and the Sciences


- In a random sample of pediatric patients at a local hospital, the age of a patient and the patient's height have a correlation of 0.8. If we use the age of the patients to predict their height, which of the following is a correct statement? a Sixty-four percent of the time, the least squares regression line accurately predicts height. b About 80% of a person's height can be explained by age, according to the regression line relating height and age. c Sixty-four percent of the variation in height can be explained by the variation in the age of a patient. d The least squares regression line relating height to age will have a slope of approximately 0.8. e About 80% of the time, age will correctly predict the height.arrow_forwardA regression line was calculated to relate the length (cm) of newborn boys to their weight in kg. The least squares regression line is weight = -5.94 + 0.1875 length. Explain in words what this model means (slop and intercept) The new- born boy was 48 cm long, what is the predicted weight of this boy? It is known that the boy is weighed 3 kg. what was his residual? What does that say about him?arrow_forwardSuppose a least-squares regression line is given by y=4.302x−3.293. What is the mean value of the response variable if x=20? μy20=_______? (Round to one decimal place as needed.)arrow_forward
- 1. What is the equation of the least squares regression line for predicting their weights from their heights? 2. I'm 35 inches tall. Predict my weight. 3. What percent of all preschoolers are shorter than me?arrow_forwardAn engineer wants to determine how the weight of a gas-powered car, x, affects the gas mileage, y. Would it be reasonable to use the least-squares regression line to predict the miles per gallon of a hybrid gas and electric car? Why and why not?arrow_forwardThe calories and sugar content per serving size of ten brands of breakfast cereal are fitted with a least squares regression line with computer outputs: (see picture) 1. What are the predicted calories for a brand with 10 g sugar per serving? 2. What were the actual calories for the brand with 10 g sugar per serving?arrow_forward
- 1. What is the equation of the least squares regression line for predicting their weights from their heights? 2. I'm 35 inches tall. Predict my weight. 3. What percent of all preschoolers are shorter than me? 4. What percent of all preschoolers are lighter than the weight you predicted for me? 5. How come you goy such different percentiles in the last two questions?arrow_forwardTo determine the effectiveness of group study sessions, a college instructor gathers data on hours of attendance and exam scores for students in the class. Which variable, hours of attendance or exam scores, would be the response variable for a least-squares regression equation? is it hours of attendance or exam scores?arrow_forwardThe data regarding the production of wheat in tons (X) and the price of the kilo of flour in Ghana cedis (Y) Takoradi some years ago were: a. Fit the regression line for the day using the method of least squaresarrow_forward
- A pediatrician wants to determine the relationship that exists between achild’s height, x, and head circumference, y. She randomly selects 11 children from her practice, measures their heights and head circumferences, and conducts the least-squares regression analysis with the simple linear model using StatCrunch. The output is given below: (a) Write down the equation of the least-squares regression line treating height as the explanatory variable and head circumference as the response variable. (b) Interpret the slope and y-intercept, if appropriate. (c) Use the regression equation to predict the head circumference of a child who is 25 inches tall. Assume that the regression model is applicable.(d) It is observed that one child who is 25 inches tall has a head circumference of 17.5 inches. Is the observed value above or below average among all children with heights of 25 inches?arrow_forwardResearchers record the fuel consumption of a car y (in miles per gallon) at various speeds x (in miles per hour). Using software, they determine that the least-squares regression line of their data is y^=70.243−0.329x If the observed fuel consumption of the car was y = 49y=49 mpg while moving at a speed of x = 20x=20mph, what would be the error (i.e., residual) in the predicted fuel consumption at this speed found with the least-squares regression line? (Do not round your answer.)arrow_forwardThe weight (in pounds) and height (in inches) for a child were measured every few months over a two-year period. The results are displayed in the scatterplot. The equation ŷ = 17.4 + 0.5x is called the least-squares regression line because it is least able to make accurate predictions for the data. makes the strongest association between weight and height. minimizes the sum of the squared distances from the actual y-value to the predicted y-value. maximizes the sum of the squared distances from the actual y-value to the predicted y-value.arrow_forward
 Linear Algebra: A Modern IntroductionAlgebraISBN:9781285463247Author:David PoolePublisher:Cengage Learning
 Glencoe Algebra 1, Student Edition, 9780079039897...AlgebraISBN:9780079039897Author:CarterPublisher:McGraw Hill