
Concept explainers
Videos
(a)
The models of the linear and quadratic form by means of regression capabilities of a graphing utility and to plot the data and the graph of the models for the data list of the values V of a mid-sized sedan from the year 2006 to the year 2012 and t is the variable that represents the time in years with
(b)
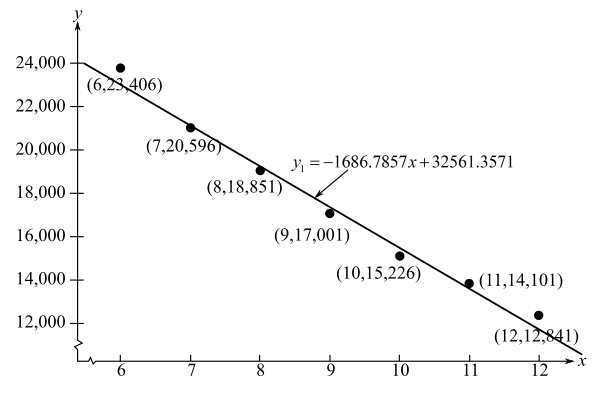
The representation of the slope of the linear model
The graph of the linear model is:
(c)
The exponential models by means of regression capabilities of a graphing utility for the data list of the values V of a mid-sized sedan from the year 2006 to the year 2012 and t is the variable that represents the time in years with
(d)
The horizontal asymptotes of the exponential model
(e)
To calculate: The rate of decrease in the value of sedan by the use of the exponential model
Want to see the full answer?
Check out a sample textbook solution
Chapter 5 Solutions
Calculus


- Making a Linear Model Make a linear model for the data in Exercise S-1. S-1. Testing Data for Linearity Test the following data to see whether they are linear. x 2 4 6 8 y 12 17 22 27arrow_forwardLife Expectancy The average life expectancy in the United States has been rising steadily over the past few decades, as shown in the table. (a) Make a scatter plot of the data. (b) Find and graph the regression line. (c) Use the linear model you found in part (b) to predict the life expectancy in the year 2006. (d) Search the Internet or your campus library to find the actual 2006 average life expectancy. Compare to your answer in part (c).arrow_forwardBiology The metabolic rate of an ectothermic organism increases with increasing temperature within a certain range. Experimental data for the oxygen consumption C (in microliters per gram per hour) of a beetle at certain temperatures can be approximated by the model C=0.45x21.65x+50.75,10x25 where x is the air temperature in degrees Celsius. a The oxygen consumption is 150 microliters per gram per hour. What is the air temperature ? b When the air temperature increases from 10C to 20C, the oxygen consumption increases by approximately what factor ?arrow_forward
- Lyme Disease The numbers Nof confirmed cases of Lyme disease in Maryland from 2007 through 2014 are shown in the table, where t represents the year, with t=7corresponding to 2007. (a) Use a graphing utility to create a scatter plot of the data. (b) Use the regression feature of the graphing utility to find a quartic model for the data. (A quartic model has the form at4+bt3+ct2+dt+e,where a,b,c,d,and e are constant and t is variable.) Graph the model in the same viewing window as the scatter plot. (c) Use the model to create a table of estimated values of N.Compare the model with the original data. (d) Use synthetic division to confirm algebraically your estimated value for the year 2014.arrow_forwardPopulation The population P (in millions) of Italy from 2003 through 2015 can be approximated by the model P=57.59e0.0051t, where t represents the year, with t=3 corresponding to 2003. (Source: U.S. Census Bureau) (a) According to the model, is the population of Italy increasing or decreasing? Explain. (b) Find the populations of Italy in 2003 and 2015. (c) Use the model to predict the populations of Italy in 2020 and 2025.arrow_forwardPopulation The population P (in millions) of Italy from 2003 through 2015 can be approximated by the model P=57.59e0.0051t, where t represents the year, with t=3 corresponding to 2003. (a) According to the model, is the population of Italy increasing or decreasing? Explain. (b) Find the populations of Italy in 2003 and 2015. (c) Use the model to predict the populations of Italy in 2020 and 2025.arrow_forward
- Graphing Discrete Data Plot the data from the table in Exercise S-2. S-2. Testing Data for Linearity Test the following data to see whether they are linear. x 2 4 6 8 y 12 17 21 25arrow_forwardTemperature The table shows the temperatures y (in degrees Fahrenheit) in a city over a 24-hour period. Let x represent the time of day, where x = 0 corresponds to 6 a.m. These data can be approximated by the model y=0.026x31.03x2+10.2x+34,0x24 Use a graphing utility to create a scatter plot of the data. Then graph the model in the same viewing window. How well does the model fit the data? Use the graph to approximate the times when the temperature was increasing and decreasing. Use the graph to approximate the maximum and minimum temperatures during this 24-hour period. Could this model predict the temperatures in the city during the next 24-hour period? Why or why not?arrow_forwardDoes the following table represent a linear function ? If so, find the linear equation that models the data.arrow_forward
 Trigonometry (MindTap Course List)TrigonometryISBN:9781337278461Author:Ron LarsonPublisher:Cengage Learning
 College AlgebraAlgebraISBN:9781305115545Author:James Stewart, Lothar Redlin, Saleem WatsonPublisher:Cengage Learning
 Algebra and Trigonometry (MindTap Course List)AlgebraISBN:9781305071742Author:James Stewart, Lothar Redlin, Saleem WatsonPublisher:Cengage Learning
 Algebra & Trigonometry with Analytic GeometryAlgebraISBN:9781133382119Author:SwokowskiPublisher:Cengage
 Glencoe Algebra 1, Student Edition, 9780079039897...AlgebraISBN:9780079039897Author:CarterPublisher:McGraw Hill