
Videos
Temperature An object at a temperature of
(a)The figure below shows the graph of the model. Use the graph to identify the horizontal asymptote of the model and interpret the asymptote in the context of the problem.
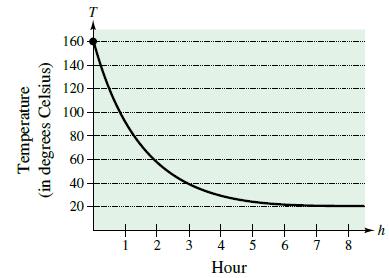
(b) Use the model to approximate the time it took for the object to reach a temperature of

Trending nowThis is a popular solution!

Chapter 5 Solutions
College Algebra


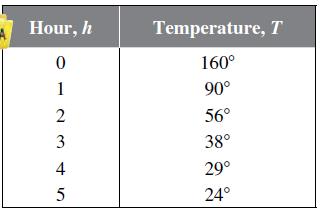
- Temperature An object at a temperature of 160C was removed from a furnace and placed in a room at 20C. The temperature T of the object was measured each hour h and recorded in the table. A model for the data is T=20+140e0.68h. (a) The figure below shows the graph of the model. Use the graph to identify the horizontal asymptote of the model and interpret the asymptote in the context of the problem. (b) Use the model to approximate the time it took for the object to reach a temperature of 100C.arrow_forwardFluid Flow The intake pipe of a 100-gallon tank has a flow rate of 10 gallons per minute, and two drainpipes have flow rates of 5 gallons per minute each. The figure shows the volume V of fluid in the tank as a function of time t. Determine whether the input pipe and each drainpipe are open or closed in specific subintervals of the 1 hour of time shown in the graph. (There are many correct answers.)arrow_forwardGetting Information from a Graph From the graph, determine the x- and y-intercepts and the vertical and horizontal asymptotes.arrow_forward
- Water Flea F. E. Smith has studied population growth for the water flea. Let N denote the population size. In one experiment, Smith found that G, the rate of growth per day in the population, can be modeled by G=0.44N(228N)228+3.46N a. Draw a graph of G versus N. Include values of N up to 350. b. At what population level does the greatest rate of growth occur? c. There are two values of N where G is zero. Find these values of N and explain what is occurring at these population levels. d. What is the rate of population growth if the population size is 300? Explain what is happening to the population at this level.arrow_forwardSales Growth In this exercise, we develop a model for the growth rate G, in thousands of dollars per year, in sales of the product as a function of the sales level s, in thousands of dollars. The model assumes that there is a limit to the total amount of sales that can be attained. In this situation, we use the term unattained sales for difference this limit and the current sales level. For example, if we expect sales grow to 3 thousand dollars in the long run, then 3-s is the unattained sales. The model states that the growth rate G is proportional to the product of the sales level s, and the unattained sales. Assume that the constant of proportionality is 0.3 and that the sales grow to 2 thousand dollars in the long run. a.Find the formula for unattained sales. b.Write an equation that shows the proportionality relation for G. c.On the basis of the equation from the part b, make a graph of G as a function of s. d.At what sales level is the growth rate as large as possible? e.What is the largest possible growth rate?arrow_forwardMagazine Circulation: The circulation C of a certain magazine as a function of time t is given by the formula C=5.20.1+0.3t Here C is measured in thousands, and t is measured in years since the beginning of 2006, when the magazine was started. a. Make a graph of C versus t covering the first 6 years of the magazines existence. b. Express using functional notation the circulation of the magazine 18 months after it was started, and then find that value. c. Over what time interval is the graph of C concave up? Explain your answer in practical terms. d. At what time was the circulation increasing the fastest?. e. Determine the limiting value for C. Explain your answer in practical terms.arrow_forward
- Colonial Population The table shows the colonial population estimates of the American colonies for each decade from 1700 through 1780. Let y represent the population in the year t, with t=0 corresponding to 1700. (a) Use the regression feature of a graphing utility to find an exponential model for the data. (b) Use the regression feature of the graphing utility to find a quadratic model for the data. (c) Use the graphing utility to plot the data and the models from parts (a) and (b) in the same viewing window. (d) Which model is a better fit for the data? Would you use this model to predict the population of the United States in 2020? Explain your reasoning.arrow_forwardDrug Concentration When a drug is administered orally, it takes some time before the blood concentration reaches its maximum level. After that time, concentration levels decrease. When 500 milligrams of procainamide is administered orally, one model for a particular patient gives blood concentration C, in milligrams per liter, after t hours as C=2.65(e0.2te2t) What is the maximum blood-level concentration, and when does that level occur?arrow_forward

 Trigonometry (MindTap Course List)TrigonometryISBN:9781337278461Author:Ron LarsonPublisher:Cengage Learning
 Algebra & Trigonometry with Analytic GeometryAlgebraISBN:9781133382119Author:SwokowskiPublisher:Cengage
 Functions and Change: A Modeling Approach to Coll...AlgebraISBN:9781337111348Author:Bruce Crauder, Benny Evans, Alan NoellPublisher:Cengage Learning
 College AlgebraAlgebraISBN:9781305115545Author:James Stewart, Lothar Redlin, Saleem WatsonPublisher:Cengage Learning
 Algebra and Trigonometry (MindTap Course List)AlgebraISBN:9781305071742Author:James Stewart, Lothar Redlin, Saleem WatsonPublisher:Cengage Learning