
Concept explainers
Videos
Population Growth A conservation organization released 100 animals of an endangered species into a game preserve. The preserve has a carrying capacity of 1000 animals. The growth of the pack is modeled by the logistic curve
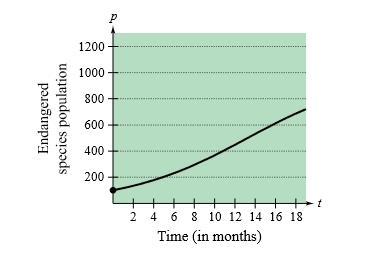
(a) Estimate the population after 5 months.
(b) After how many months is the population 500?
(c) Use a graphing utility to graph the function. Use the graph to determine the horizontal asymptotes, and interpret the meaning of the asymptotes in the context of the problem

Trending nowThis is a popular solution!

Chapter 5 Solutions
College Algebra


- Bird Population The population of a certain species of bird is limited by the type of habitat required for nesting. The population behaves according to the logistic growth model n(t)=56000.5+27.5e0.044t where t is measured in years. a Find the initial bird population. b Draw a graph of the function n(t). c What size does the population approach as time goes on?arrow_forwardLogistic Population growth the table and scatter plot give the population of black flies in a closed laboratory container over an 18 day period. (a) Use the logistic command on your calculator to find a logistic model for these data. (b) Use the model to estimate the time when there were 400 flies in the containerarrow_forwardCompound Interest Complete the table for the time t (in years) necessary for P dollars to triple when it is invested at an interest rate r compounded (a) continuously and (b) annually.arrow_forward
- Population of Foxes A breeding group of foxes is introduced into a protected area and exhibits logistic population growth. After t years, the number of foxes is given by N(t)=37.50.25+0.76tfoxes. a. Make a graph of N versus t covering the first 20 years. b. Calculate N(9) and explain in practical terms what your answer means. c. For what values of t is the graph concave up? For what values is it concave down? d. What is the carrying capacity the limiting value of N?arrow_forwardLogistic Growth Animal populations are not capable of unrestricted growth because of limited habitat and food supplies. Under such conditions the population follows a logistic growth model: p(t)=d1+kea Where c, d, and k are positive constants. For a certain fish population in a small pond d=1200, k=11, c=0.2, and t is measured in years. The fish were introduced into the pond at time t=0 . How many fish were originally put in the pond? Find the population after 10, 20, and 30 years. Evaluate p(t) for large values of t. What value does the population approach as t? Does the graph shown confirm your calculations?arrow_forwardA Population of Foxes A breeding group of foxes is introduced into a protected are and exhibits logistic population growth. After t years, the number of foxes is given by N(t)=37.50.25+0.76t foxes. a. How many foxes were introduced into the protected area? b. Calculate N(5) and explain the meaning of the number you have calculated. c. Explain how the population varies with time. Include in your explanation the average rate of increase over the first 10-year period and the average rate of increase over the second 10-year period. d. Find the carrying capacity for foxes in the protected area. e. As we saw in the discussion of terminal velocity for a skydiver, the question of when the carrying capacity is reached may lead to an involved discussion. We ask the question differently. When is 99 of carrying capacity reached?arrow_forward
- Modeling Human Height with a Logistic Function A male child is 21inches long at birth and grows to an adult height of 73inches. In this exercise, we make a logistic model of his height as a function of age. a. Use the given information to find K and b for the logistic model. b. Suppose he reaches 95 of his adult height at age 16. Use this information and that from part a to find r. Suggestion: You will need to use either the crossing-graphs method or some algebra involving the logarithm. c. Make a logistic model for his height H, in inches, as a function of his age t, in years. d. According to the logistic model, at what age is he growing the fastest? e. Is your answer to part d consistent with your knowledge of how humans grow?arrow_forwardBird Population The population of a certain species of bird is limited by the type of habitat required for nesting. The population behaves according to the logistic growth model p(t)=73.26.1+5.9e0.02r Where t is measured in years. Find the initial bird population. Draw a graph of the function n(t) . What size does the population approach as time goes on?arrow_forwardLogistic Growth Animal populations are not capable of unrestricted growth becomes of limited habitat and food supplies. Under such conditions the population follows a logistic growth model: P(t)=d1+kect where c, d, and k are positive constants. For a certain fish population is a small pond d=1200,k=11,c=0.2, and t is measured in years. The fish were introduced into the pond at time t=0. a How many fish were originally put in the pond? b Find the population after 10, 20, and 30 years. c Evaluate P(t) for large values of t. What value does the population approach as t? Does the graph show confirm your calculations?arrow_forward
- Ventilation Rate In Exercise 21 and 22, use the model y=80.411lnx,100x1500 which approximates the minimum required ventilation rate in terms of the air space per child in a public school classroom. In the model, x is the air space (in cubic feet) per child and y is the ventilation rate (in cubic feet per minute) per child. Use a graphing utility to graph the model and approximate the required ventilation rate when there are 300 cubic feet of air space per child.arrow_forwardPopulation Growth These exercises use the population growth model. 5. FOX Population The fox population in a certain region has a relative growth rate Of8% per year. It is estimated that the population in 2013 was 18,000. (a) find a function n(t)=n0ert that models the population t years after 2013. (b) Use the function from part (a) to estimate the fox population in the year 2021. (e) After how many years will fox population reach 25,000. (d) Sketch a graph Of the fox population function for the years 2013-2021.arrow_forwardPopulation Growth These exercises use the population growth model. 3. Squirrel Population A grey squirrel population was intro-duced in a certain county or Great Britain 30 years ago. Biologists observe that thepopulation double every 6 years, and now population is 100,000. (a) What was the initial size Of the squirrel population? (b) Estimate the squirrel population 10 years from now. (e) Sketch a graph of the squirrel population.arrow_forward

 Trigonometry (MindTap Course List)TrigonometryISBN:9781337278461Author:Ron LarsonPublisher:Cengage Learning
 Algebra and Trigonometry (MindTap Course List)AlgebraISBN:9781305071742Author:James Stewart, Lothar Redlin, Saleem WatsonPublisher:Cengage Learning
 College AlgebraAlgebraISBN:9781305115545Author:James Stewart, Lothar Redlin, Saleem WatsonPublisher:Cengage Learning
 Functions and Change: A Modeling Approach to Coll...AlgebraISBN:9781337111348Author:Bruce Crauder, Benny Evans, Alan NoellPublisher:Cengage Learning
 Algebra & Trigonometry with Analytic GeometryAlgebraISBN:9781133382119Author:SwokowskiPublisher:Cengage