
Concept explainers
Videos
Car Speed The table shows the time
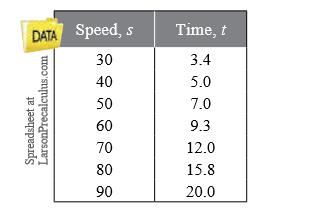
Two models for these data are given below.
(a) Use the regression feature of a graphing utility to find a linear model
(b) Use the graphing utility to graph the data and each model in the same viewing window.
(c) Create a table comparing the data with estimates obtained from each model.
(d) Use the results of part (c) to find the sum of the absolute values of the differences between the data and the estimated values found using each model. Based on the four sums, which model do you think best fits the data? Explain.
Want to see the full answer?
Check out a sample textbook solution
Chapter 5 Solutions
College Algebra


- Colonial Population The table shows the colonial population estimates of the American colonies for each decade from 1700 through 1780. Let y represent the population in the year t, with t=0 corresponding to 1700. (a) Use the regression feature of a graphing utility to find an exponential model for the data. (b) Use the regression feature of the graphing utility to find a quadratic model for the data. (c) Use the graphing utility to plot the data and the models from parts (a) and (b) in the same viewing window. (d) Which model is a better fit for the data? Would you use this model to predict the population of the United States in 2020? Explain your reasoning.arrow_forwardPopulation The table shows the mid-year populations (in millions) of five countries in 2015 and the projected populations (in millions) for the year 2025. (a) Find the exponential growth or decay model y=aebt or y=aebt for the population of each country by letting t=15 correspond to 2015. Use the model to predict the population of each country in 2035. (b) You can see that the populations of the United States and the United Kingdom are growing at different rates. What constant in the equation y=aebt gives the growth rate? Discuss the relationship between the different growth rates and the magnitude of the constant.arrow_forwardPopulation The population P (in millions) of Italy from 2003 through 2015 can be approximated by the model P=57.59e0.0051t, where t represents the year, with t=3 corresponding to 2003. (a) According to the model, is the population of Italy increasing or decreasing? Explain. (b) Find the populations of Italy in 2003 and 2015. (c) Use the model to predict the populations of Italy in 2020 and 2025.arrow_forward
- Population The population P (in millions) of Italy from 2003 through 2015 can be approximated by the model P=57.59e0.0051t, where t represents the year, with t=3 corresponding to 2003. (Source: U.S. Census Bureau) (a) According to the model, is the population of Italy increasing or decreasing? Explain. (b) Find the populations of Italy in 2003 and 2015. (c) Use the model to predict the populations of Italy in 2020 and 2025.arrow_forwardLogistic Growth Animal populations are not capable of unrestricted growth becomes of limited habitat and food supplies. Under such conditions the population follows a logistic growth model: P(t)=d1+kect where c, d, and k are positive constants. For a certain fish population is a small pond d=1200,k=11,c=0.2, and t is measured in years. The fish were introduced into the pond at time t=0. a How many fish were originally put in the pond? b Find the population after 10, 20, and 30 years. c Evaluate P(t) for large values of t. What value does the population approach as t? Does the graph show confirm your calculations?arrow_forwardLyme Disease The numbers Nof confirmed cases of Lyme disease in Maryland from 2007 through 2014 are shown in the table, where t represents the year, with t=7corresponding to 2007. (a) Use a graphing utility to create a scatter plot of the data. (b) Use the regression feature of the graphing utility to find a quartic model for the data. (A quartic model has the form at4+bt3+ct2+dt+e,where a,b,c,d,and e are constant and t is variable.) Graph the model in the same viewing window as the scatter plot. (c) Use the model to create a table of estimated values of N.Compare the model with the original data. (d) Use synthetic division to confirm algebraically your estimated value for the year 2014.arrow_forward

 Trigonometry (MindTap Course List)TrigonometryISBN:9781337278461Author:Ron LarsonPublisher:Cengage Learning
 Algebra and Trigonometry (MindTap Course List)AlgebraISBN:9781305071742Author:James Stewart, Lothar Redlin, Saleem WatsonPublisher:Cengage Learning
 College AlgebraAlgebraISBN:9781305115545Author:James Stewart, Lothar Redlin, Saleem WatsonPublisher:Cengage Learning
 Functions and Change: A Modeling Approach to Coll...AlgebraISBN:9781337111348Author:Bruce Crauder, Benny Evans, Alan NoellPublisher:Cengage Learning
 Algebra & Trigonometry with Analytic GeometryAlgebraISBN:9781133382119Author:SwokowskiPublisher:Cengage