
Mathematical Statistics with Applications
7th Edition
ISBN: 9780495110811
Author: Dennis Wackerly, William Mendenhall, Richard L. Scheaffer
Publisher: Cengage Learning
expand_more
expand_more
format_list_bulleted
Videos
Textbook Question
Chapter 5.7, Problem 89E
In Exercise 5.1, we determined that the joint distribution of Y1, the number of contracts awarded to firm A, and Y2, the number of contracts awarded to firm B, is given by the entries in the following table.
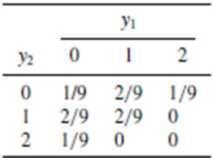
Find Cov(Y1, Y2). Does it surprise you that Cov(Y1, Y2) is negative? Why?
5.1 Contracts for two construction jobs are randomly assigned to one or more of three firms. A, B, and C. Let Y1 denote the number of contracts assigned to firm A and Y2 the number of contracts assigned to firm B. Recall that each firm can receive 0, 1, or 2 contracts.
- a Find the joint probability
function for Y1 and Y2. - b Find F(1, 0).
Expert Solution & Answer

Trending nowThis is a popular solution!

Students have asked these similar questions
From the analysis of wages paid to employees in two service organizations X and Y, the following were obtained:
Organization X Organization YNumber of wage earners 550 650Average monthly earnings 5,000 4,500Variance of the distribution of wages 900 1600
(i) Which organization pays a larger amount as monthly wages? (ii) In which organization is there greater variability in individual wages of all the wage earners taken together?
In a study of a group of women science majors who remained in their profession and a group who left their profession within a few months of graduation, the researchers collected the data shown here on a self-esteem questionnaire.
Leavers Stayers1 = 3.05 2 = 2.92σ1 = 0.71 σ2 = 0.71n1 = 100 n2 = 227At α = 0.05, can it be concluded that there is a difference in the self-esteem scores of the two groups? Use the P-value method.
A group of high-risk automobile drivers (with three moving violations in one year) are required, according to random assignment, either to attend a traffic school or to perform supervised volunteer work. During the subsequent five-year period, these same drivers were cited for the following number of moving violations:
NUMBER OF MOVING VIOLATIONS
TRAFFIC SCHOOL VOLUNTEER WORK
0 26
0 7
15 4
9 1
7 1
0 14
2 6
23 10
7
8
Why might the Mann–Whitney U test be preferred to the t test for these data?
Use U to test the null hypothesis at the .05 level of significance.
Specify the approximate p-value for this test result.
Chapter 5 Solutions
Mathematical Statistics with Applications
Ch. 5.2 - Contracts for two construction jobs are randomly...Ch. 5.2 - Three balanced coins are tossed independently. One...Ch. 5.2 - Of nine executives in a business firm, four are...Ch. 5.2 - Given here is the joint probability function...Ch. 5.2 - Refer to Example 5.4. The joint density of Y1, the...Ch. 5.2 - Prob. 6ECh. 5.2 - Let Y1 and Y2 have joint density function...Ch. 5.2 - Prob. 8ECh. 5.2 - Prob. 9ECh. 5.2 - An environmental engineer measures the amount (by...
Ch. 5.2 - Suppose that Y1 and Y2 are uniformly distributed...Ch. 5.2 - Prob. 12ECh. 5.2 - Prob. 13ECh. 5.2 - Prob. 14ECh. 5.2 - The management at a fast-food outlet is interested...Ch. 5.2 - Let Y1 and Y2 denote the proportions of time (out...Ch. 5.2 - Let (Y1, Y2) denote the coordinates of a point...Ch. 5.2 - Prob. 18ECh. 5.3 - In Exercise 5.1, we determined that the joint...Ch. 5.3 - Refer to Exercise 5.2. a Derive the marginal...Ch. 5.3 - In Exercise 5.3, we determined that the joint...Ch. 5.3 - In Exercise 5.4, you were given the following...Ch. 5.3 - In Example 5.4 and Exercise 5.5, we considered the...Ch. 5.3 - Prob. 24ECh. 5.3 - Prob. 25ECh. 5.3 - Prob. 26ECh. 5.3 - Prob. 27ECh. 5.3 - In Exercise 5.10, we proved that...Ch. 5.3 - Prob. 29ECh. 5.3 - In Exercise 5.12, we were given the following...Ch. 5.3 - In Exercise 5.13, the joint density function of Y1...Ch. 5.3 - Prob. 32ECh. 5.3 - Suppose that Y1 is the total time between a...Ch. 5.3 - Prob. 34ECh. 5.3 - Prob. 35ECh. 5.3 - Prob. 36ECh. 5.3 - Prob. 37ECh. 5.3 - Let Y1 denote the weight (in tons) of a bulk item...Ch. 5.3 - Prob. 39ECh. 5.3 - Prob. 40ECh. 5.3 - Prob. 41ECh. 5.3 - Prob. 42ECh. 5.4 - Let Y1 and Y2 have joint density function f(y1,...Ch. 5.4 - Prob. 44ECh. 5.4 - Prob. 45ECh. 5.4 - Prob. 46ECh. 5.4 - In Exercise 5.3, we determined that the joint...Ch. 5.4 - In Exercise 5.4, you were given the following...Ch. 5.4 - In Example 5.4 and Exercise 5.5, we considered the...Ch. 5.4 - Prob. 50ECh. 5.4 - Prob. 51ECh. 5.4 - Prob. 52ECh. 5.4 - Prob. 53ECh. 5.4 - Prob. 54ECh. 5.4 - Prob. 55ECh. 5.4 - In Exercise 5.12, we were given the following...Ch. 5.4 - Prob. 57ECh. 5.4 - Suppose that the random variables Y1 and Y2 have...Ch. 5.4 - If Y1 is the total time between a customers...Ch. 5.4 - Prob. 60ECh. 5.4 - Prob. 61ECh. 5.4 - Prob. 62ECh. 5.4 - Let Y1 and Y2 be independent exponentially...Ch. 5.4 - Prob. 64ECh. 5.4 - Prob. 65ECh. 5.4 - Let F1(y1) and F2(y2) be two distribution...Ch. 5.4 - Prob. 67ECh. 5.4 - Prob. 68ECh. 5.4 - The length of life Y for fuses of a certain type...Ch. 5.4 - A bus arrives at a bus stop at a uniformly...Ch. 5.4 - Prob. 71ECh. 5.6 - In Exercise 5.1, we determined that the joint...Ch. 5.6 - Prob. 73ECh. 5.6 - Refer to Exercises 5.6, 5.24, and 5.50. Suppose...Ch. 5.6 - Prob. 75ECh. 5.6 - Prob. 76ECh. 5.6 - Prob. 77ECh. 5.6 - Prob. 78ECh. 5.6 - Suppose that, as in Exercise 5.11, Y1 and Y2 are...Ch. 5.6 - In Exercise 5.16, Y1 and Y2 denoted the...Ch. 5.6 - In Exercise 5.18, Y1 and Y2 denoted the lengths of...Ch. 5.6 - In Exercise 5.38, we determined that the joint...Ch. 5.6 - Prob. 83ECh. 5.6 - In Exercise 5.62, we considered two individuals...Ch. 5.6 - Prob. 85ECh. 5.6 - Prob. 86ECh. 5.6 - Prob. 87ECh. 5.6 - Prob. 88ECh. 5.7 - In Exercise 5.1, we determined that the joint...Ch. 5.7 - Prob. 90ECh. 5.7 - In Exercise 5.8, we derived the fact that...Ch. 5.7 - Prob. 92ECh. 5.7 - Suppose that, as in Exercises 5.11 and 5.79, Y1...Ch. 5.7 - Prob. 94ECh. 5.7 - Prob. 95ECh. 5.7 - Prob. 96ECh. 5.7 - The random variables Y1 and Y2 are such that E(Y1)...Ch. 5.7 - Prob. 98ECh. 5.7 - Prob. 99ECh. 5.7 - Let Z be a standard normal random variable and let...Ch. 5.7 - Prob. 101ECh. 5.8 - A firm purchases two types of industrial...Ch. 5.8 - Prob. 103ECh. 5.8 - Prob. 104ECh. 5.8 - Prob. 105ECh. 5.8 - In Exercise 5.9, we determined that...Ch. 5.8 - In Exercise 5.12, we were given the following...Ch. 5.8 - If Y1 is the total time between a customers...Ch. 5.8 - In Exercise 5.16, Y1 and Y2 denoted the...Ch. 5.8 - Suppose that Y1 and Y2 have correlation...Ch. 5.8 - Prob. 111ECh. 5.8 - In Exercise 5.18, Y1 and Y2 denoted the lengths of...Ch. 5.8 - A retail grocery merchant figures that her daily...Ch. 5.8 - For the daily output of an industrial operation,...Ch. 5.8 - Prob. 115ECh. 5.8 - Prob. 116ECh. 5.8 - A population of N alligators is to be sampled in...Ch. 5.8 - Prob. 118ECh. 5.9 - A learning experiment requires a rat to run a maze...Ch. 5.9 - Prob. 120ECh. 5.9 - Refer to Exercise 5.117. Suppose that the number N...Ch. 5.9 - The weights of a population of mice fed on a...Ch. 5.9 - Prob. 123ECh. 5.9 - The typical cost of damages caused by a fire in a...Ch. 5.9 - When commercial aircraft are inspected, wing...Ch. 5.9 - Prob. 126ECh. 5.9 - Prob. 127ECh. 5.10 - Let Y1 and Y2 have a bivariate normal...Ch. 5.10 - Prob. 129ECh. 5.10 - Prob. 130ECh. 5.10 - Prob. 131ECh. 5.10 - Prob. 132ECh. 5.11 - Prob. 133ECh. 5.11 - Prob. 134ECh. 5.11 - In Exercise 5.41, we considered a quality control...Ch. 5.11 - In Exercise 5.42, the number of defects per yard...Ch. 5.11 - In Exercise 5.38, we assumed that Y1, the weight...Ch. 5.11 - Assume that Y denotes the number of bacteria per...Ch. 5.11 - Prob. 139ECh. 5.11 - Prob. 140ECh. 5.11 - Let Y1 have an exponential distribution with mean ...Ch. 5.11 - Prob. 142ECh. 5.11 - Prob. 143ECh. 5 - Prove Theorem 5.9 when Y1 and Y2 are independent...Ch. 5 - Prob. 145SECh. 5 - Prob. 146SECh. 5 - Two friends are to meet at the library. Each...Ch. 5 - Prob. 148SECh. 5 - Prob. 149SECh. 5 - Prob. 150SECh. 5 - The lengths of life Y for a type of fuse has an...Ch. 5 - In the production of a certain type of copper, two...Ch. 5 - Suppose that the number of eggs laid by a certain...Ch. 5 - In a clinical study of a new drug formulated to...Ch. 5 - Prob. 155SECh. 5 - Refer to Exercise 5.86. Suppose that Z is a...Ch. 5 - Prob. 157SECh. 5 - Prob. 158SECh. 5 - Prob. 159SECh. 5 - Prob. 160SECh. 5 - Suppose that we are to observe two independent...Ch. 5 - Prob. 162SECh. 5 - Prob. 163SECh. 5 - Prob. 164SECh. 5 - Prob. 165SECh. 5 - Prob. 166SECh. 5 - Prob. 167SE
Knowledge Booster


Learn more about
Need a deep-dive on the concept behind this application? Look no further. Learn more about this topic, statistics and related others by exploring similar questions and additional content below.Similar questions
- In a breeding experiment, chicken with white feathers, small comb were mated and the offspring categories white feathers, small comb (WS), white feathers. large comb (WL), dark feathers, small comb (DS) and dark feathers, large comb (DL) were expected to follow the ratio 9:3:3:1 the researcher observed that there were 100 WS, 32 WL, 40 DS and 20 DL offspring. In order to test if the observed frequencies follow the expected ratio, what should be the hull hypothesis?A. P(WS) = 100/192, P(WL) = 32/192, P(DS) = 40/192 , P(DL) = 20/192 B. P(WS) = 100 , P(WL) = 32, P(DS) = 40, P(DL) = 20 C. P(WS) = 9/16 , P(WL) = 3/16, P(DS) = 3/16, P(DL) = 1/16 D. P(WS) = 9, P(WL) = 3, P(DS) = 3 , P(DL) = 1 2. In Problem 1, what would be the degree of freedom for an appropriate test?A.2 B.3 C.4 D.1 3. What is the value of the computed test statistic in problem 1? A.7.81 B.3.84 C.6.81 D.5.99 5.What would be the p-value for this test in problem 1? A.0.28 B.0.05 C.0.08 D. 0.11 6. At 5-% level of significance,…arrow_forwarda major cereal manufacturer is awarding prize certificates in its #1 cereal. a random sample of 60 cereal boxes is selected and 5 are found to contain prize certificates. find the 90% C.I for the true proportion of prize certificates.arrow_forwardIn a study of a group of women science majors who remained in their profession and a group who left their profession within a few months of graduation, the researchers collected the data shown here on a self-esteem questionnaire. Leavers Stayers 1 = 3.09 2 = 2.92 σ1 = 0.78 σ2 = 0.78 n1 = 107 n2 = 222 At α = 0.01, can it be concluded that there is a difference in the self-esteem scores of the two groups? Use the P-value method.arrow_forward
- The following data show the number of class sessions missed during a semester of SOC221 and the final grade for a sample of 8 students selected at random. Number of Sessions Missed Final Grade (x) (y) 0 96 2 88 12 68 6 91 8…arrow_forwardA marketing research group found that 25% of the 200 shoppers, it recently interviewed at a certain shopping center, resided more than 12 miles from the center. Assume that a random sample was taken, construct a 95% C.I. for the actual; percentage of shoppers who live more than 15 miles from that center.arrow_forwardChapter 6, Section 5, Exercise 236 Use a t-distribution and the given matched pair sample results to complete the test of the given hypotheses. Assume the results come from random samples, and if the sample sizes are small, assume the underlying distribution of the differences is relatively normal. Assume that differences are computed using d=x1-x2.Test H0 : μd=0 vs Ha : μd≠0 using the paired difference sample results x¯d=10.51, sd=11.6, nd=25. Give the test statistic and the p-value.Round your answer for the test statistic to two decimal places and your answer for the p-value to three decimal places.test statistic = Enter your answer; test statisticp-value = Enter your answer; p-value Give the conclusion using a 5% significance level. Reject H0. Do not reject H0.arrow_forward
- For a study that had 40 total participants equally distributed among the 4 groups and an MSW of 4.65, which of the following is the correct result of the Tukey’s HSD calculation (.05 alpha level)? 4.09 4.15 4.79 5.18arrow_forwardThe Weight and Blood Pressure of 26 Randomly Selected Male People in a Group ages 25 to 30 are shown in the following table. Suppose weight and blood pressure are normally and jointly distributed Y= 69.1044 + 0.4194x A)Test the hypothesis that rho = 0 and test the hypothesis that rho = 0.6arrow_forwardA researcher was interested in studying if there is a significant relationship between the severity of COVID 19 and blood types of individuals. 2400 individuals were studied and the results are shown below. blood types condition O A B AB Total critical 64 44 20 8 136 severe 175 129 50 15 369 moderate 211 528 151 125 1015 mild 200 400 140 140 880 total 650 1101 361 288 2400 a. State both the null and alternative hypotheses. b. Provide the decision rule for making this decision. Use an alpha level of 5%. c. Show all of the work necessary to calculate the appropriate statistic. d. What conclusion are you allowed to draw? e. Would your conclusion change at the 10% level of significance? [2 marks]arrow_forward
- A sample of men and women who had passed their driver's test either the first time or the second time were surveyed, with the following results: Results of the driving testGender First time Second timeMen 126 211Women 135 178a) Do these data suggest that there is a relationship between gender and the passing of their driver’s test from which the present sample was drawn? Let alpha=.05arrow_forwardA researcher was interested in studying if there is a significant relationship between the severity of COVID 19 and blood types of individuals. 2400 individuals were studied and the results are shown below. Condition Blood Type O A B AB Total Critical 64 44 20 8 136 Severe 175 129 50 15 369 Moderate 211 528 151 125 1015 Mild 200 400 140 140 880 Total 650 1101 361 288 2400 a. State both the null and alternative hypotheses.b. Provide the decision rule for making this decision. Use an alpha level of 5%. c. Show all of the work necessary to calculate the appropriate statistic.d. What conclusion are you allowed to draw?e. Would your conclusion change at the 10% level of significance?f. Confirm test results in part (c) using JASP. Note: All JASP input files and outputtables should be providedarrow_forwardA researcher was interested in studying if there is a significant relationship between the severity of COVID 19 and blood types of individuals. 2400 individuals were studied and the results are shown below. Condition Blood Type O A B AB Total Critical 64 44 20 8 136 Severe 175 129 50 15 369 Moderate 211 528 151 125 1015 Mild 200 400 140 140 880 Total 650 1101 361 288 2400 a. State both the null and alternative hypotheses. b. Provide the decision rule for making this decision. Use an alpha level of 5%. c. Show all of the work necessary to calculate the appropriate statistic. d. What conclusion are you allowed to draw? e. Would your conclusion change at the 10% level of significance?arrow_forward
arrow_back_ios
SEE MORE QUESTIONS
arrow_forward_ios
Recommended textbooks for you
 Algebra & Trigonometry with Analytic GeometryAlgebraISBN:9781133382119Author:SwokowskiPublisher:Cengage
Algebra & Trigonometry with Analytic Geometry
Algebra
ISBN:9781133382119
Author:Swokowski
Publisher:Cengage
Hypothesis Testing using Confidence Interval Approach; Author: BUM2413 Applied Statistics UMP;https://www.youtube.com/watch?v=Hq1l3e9pLyY;License: Standard YouTube License, CC-BY
Hypothesis Testing - Difference of Two Means - Student's -Distribution & Normal Distribution; Author: The Organic Chemistry Tutor;https://www.youtube.com/watch?v=UcZwyzwWU7o;License: Standard Youtube License