USING+UNDERSTAND MATH W/MATHLABPLUS >I
15th Edition
ISBN: 9781269927116
Author: Bennett
Publisher: PEARSON
bartleby

Concept explainers

bartleby

Videos

Textbook Question
Book Icon
Chapter 5.A, Problem 1QQ

You conduct a poll in which you randomly select 1000 registered voters from Texas and ask if they approve of the job their governor is doing. The population for this study is

a. all registered voters in the state of Texas.

b. the 1000 people that you interview.

c. the governor of Texas.

Expert Solution & Answer
Check Mark
To determine

What is meant by Population of a study.

Answer to Problem 1QQ

Solution:

a. All registered voters in the state of Texas.

Explanation of Solution

Given:

Here in our question a poll is conducted by randomly selecting 1000 registered voters from Texas and ask if they approve of the job of their Governor is Doing.

Explanation:

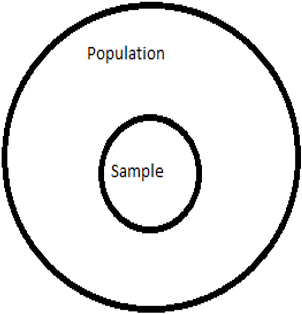
In any statistical survey we select a bunch of people from the entire pool and conduct our survey on them and we try to estimate the actual parameter. The bunch of people we select is known as Sample and the entire pool of people from which the Sample is selected is known as Population.

For Example: If I want to know who is going to win in next election for mayor in a city, I select randomly a set of people from all different streets of the city and ask them who is going to win among Mr. X and Mr. Y. So, who ever got the majority of votes from the people we selected, I conclude that person is going to win the next mayor election. So here the bunch of people selected are known as Sample and All the people who can vote in the city are known to be the Population.

USING+UNDERSTAND MATH W/MATHLABPLUS >I, Chapter 5.A, Problem 1QQ

Conclusion:

So here the selected 1000 registered voters from Texas whom we asked about Governor is our Sample and our Sample is selected from entire registered voters in Texas. So, all registered voters in Texas is our Population.

Want to see more full solutions like this?

Subscribe now to access step-by-step solutions to millions of textbook problems written by subject matter experts!
01:23

Chapter 5 Solutions

USING+UNDERSTAND MATH W/MATHLABPLUS >I

Ch. 5.A - 1. Why do we say that the term statistics has two...Ch. 5.A - 2. Define the terms populatíon, sample, population...Ch. 5.A - Describe the five basic steps in a statistical...Ch. 5.A - Why is a so important that a statistical study use...Ch. 5.A - Prob. 5ECh. 5.A - Prob. 6ECh. 5.A - What is a placebo? Describe the placebo effect and...Ch. 5.A - What is meant by the margin of error in a survey...Ch. 5.A - In my experimental study, I used a sample that was...Ch. 5.A - I followed all the guidelines for sample selection...Ch. 5.A - I wanted to test the effects of vitamin C on...Ch. 5.A - I don’t believe the results of the experiment...Ch. 5.A - Prob. 13ECh. 5.A - By choosing my sample carefully, I can make a good...Ch. 5.A - Population and Sample. For the following studies,...Ch. 5.A - 15–20: Population and Sample. For the following...Ch. 5.A - 15–20: Population and Sample. For the following...Ch. 5.A - 15–20: Population and Sample. For the following...Ch. 5.A - Population and Sample. For the following studies,...Ch. 5.A - Population and Sample. For the following studies,...Ch. 5.A - Steps in a Study. Describe how you would apply the...Ch. 5.A - Prob. 22ECh. 5.A - Prob. 23ECh. 5.A - Steps in a Study. Describe how you would apply the...Ch. 5.A - Prob. 25ECh. 5.A - Prob. 26ECh. 5.A - Representative Sample? You want to determine the...Ch. 5.A - Representative Sample? You want to determine the...Ch. 5.A - Identify the Sampling Method. Identify the...Ch. 5.A - Identify the Sampling Method. Identify the...Ch. 5.A - Identify the Sampling Method. Identify the...Ch. 5.A - 29–34: Identify the Sampling Method. Identify the...Ch. 5.A - Identify the Sampling Method. Identify the...Ch. 5.A - Identify the Sampling Method. Identify the...Ch. 5.A - Type of Study. Determine whether the following...Ch. 5.A - Type of Study. Determine whether the following...Ch. 5.A - Type of Study. Determine whether the following...Ch. 5.A - Type of Study. Determine whether the following...Ch. 5.A - Type of Study. Determine whether the following...Ch. 5.A - Type of Study. Determine whether the following...Ch. 5.A - What Type of Study? What type of statistical study...Ch. 5.A - What Type of Study? What type of statistical study...Ch. 5.A - What Type of Study? What type of statistical study...Ch. 5.A - Prob. 44ECh. 5.A - Prob. 45ECh. 5.A - Prob. 46ECh. 5.A - Margin of Error. The following summaries of...Ch. 5.A - Prob. 48ECh. 5.A - Margin of Error. The following summaries of...Ch. 5.A - Margin of Error. The following summaries of...Ch. 5.A - Prob. 51ECh. 5.A - Prob. 52ECh. 5.A - Prob. 53ECh. 5.A - Prob. 54ECh. 5.A - Real Studies. Consider the following statistical...Ch. 5.A - Real Studies. Consider the following statistical...Ch. 5.A - Prob. 57ECh. 5.A - Prob. 58ECh. 5.A - Prob. 59ECh. 5.A - Prob. 60ECh. 5.A - Statistics in the News. Select three news stories...Ch. 5.A - 62. Statistics in Your Major. Write two to three...Ch. 5.A - Prob. 63ECh. 5.A - Prob. 64ECh. 5.A - 65. Poor Sampling. Find a new article about a...Ch. 5.A - 66. Good Sampling. Find a recent news article that...Ch. 5.A - 67. Margin of Error. Find a report of a recent...Ch. 5.A - Prob. 68ECh. 5.A - Prob. 69ECh. 5.B - You read about an issue that was the subject of an...Ch. 5.B - A study conducted by the oil company Exxon Mobil...Ch. 5.B - Consider a study designed to learn about the...Ch. 5.B - The show American Idol selects winners based on...Ch. 5.B - Consider an experiment in which you measure the...Ch. 5.B - Consider a survey in which 1000 people are asked...Ch. 5.B - Imagine that a survey of randomly selected people...Ch. 5.B - You want to know whether people prefer Smith or...Ch. 5.B - A self-selected survey is one in which a. the...Ch. 5.B - If a statistical study is carefully conducted tn...Ch. 5.B - Prob. 1ECh. 5.B - Prob. 2ECh. 5.B - Prob. 3ECh. 5.B - Prob. 4ECh. 5.B - The TV survey got more than 1 million...Ch. 5.B - Thc survey of religious beliefs suffered from...Ch. 5.B - My experiment proved beyond a doubt that vitamin C...Ch. 5.B - Everyone who jogs for exercise should try the new...Ch. 5.B - Should You Believe This Study? Based solely on the...Ch. 5.B - Should You Believe This Study? Based solely on the...Ch. 5.B - Prob. 11ECh. 5.B - 9–20: Should You Believe This Study? Based solely...Ch. 5.B - Should You Believe This Study? Based solely on the...Ch. 5.B - Should You Believe This Study? Based solely on the...Ch. 5.B - Should You Believe This Study? Based solely on the...Ch. 5.B - Should You Believe This Study? Based solely on the...Ch. 5.B - Prob. 17ECh. 5.B - Should You Believe This Study? Based solely on the...Ch. 5.B - Should You Believe This Study? Based solely on the...Ch. 5.B - Prob. 20ECh. 5.B - 21–26: Should You Believe This Claim? Based solely...Ch. 5.B - Should You Believe This Claim? Based solely on the...Ch. 5.B - Prob. 23ECh. 5.B - Prob. 24ECh. 5.B - Prob. 25ECh. 5.B - Should You Believe This Claim? Based solely on the...Ch. 5.B - Prob. 27ECh. 5.B - Prob. 28ECh. 5.B - Prob. 29ECh. 5.B - Prob. 30ECh. 5.B - Prob. 31ECh. 5.B - Prob. 32ECh. 5.B - Bias. Identify at least one potential source of...Ch. 5.B - Prob. 34ECh. 5.B - 35. Its All in the Wording. Princeton Survey...Ch. 5.B - Prob. 36ECh. 5.B - Prob. 37ECh. 5.B - Stat-Bytes. Much like sound bytes of news stories,...Ch. 5.B - Prob. 39ECh. 5.B - Prob. 40ECh. 5.B - Prob. 41ECh. 5.B - Prob. 42ECh. 5.B - Accurate Headlines? Consider the following...Ch. 5.B - 43–44: Accurate Headlines? Consider the following...Ch. 5.B - 45. What is the Question? Discuss the differences...Ch. 5.B - 46. Exercise and Dementia. A recent study in the...Ch. 5.B - Prob. 47ECh. 5.B - Prob. 48ECh. 5.B - Prob. 49ECh. 5.B - Prob. 50ECh. 5.C - Prob. 1QQCh. 5.C - For the class described in question 1, what was...Ch. 5.C - Prob. 3QQCh. 5.C - The sizes of the wedges in a pie chart tell you a....Ch. 5.C - You have a table listing ten tourist attractions...Ch. 5.C - In the table of tourist attractions and visitors...Ch. 5.C - You have a list of the GPAs of 100 college...Ch. 5.C - You have a list of the average gasoline price for...Ch. 5.C - A histogram is a. a graph that shows how some...Ch. 5.C - You have a histogram and you want to convert it...Ch. 5.C - Prob. 1ECh. 5.C - Prob. 2ECh. 5.C - Prob. 3ECh. 5.C - Prob. 4ECh. 5.C - Prob. 5ECh. 5.C - 6. What two types of graphs are most common when...Ch. 5.C - I made a frequency table with two columns, one...Ch. 5.C - The relative frequency of B grades in our class...Ch. 5.C - Prob. 9ECh. 5.C - Prob. 10ECh. 5.C - Prob. 11ECh. 5.C - Your pie chart must be wrong, because when I added...Ch. 5.C - Prob. 13ECh. 5.C - I rearranged the bars on my histogram the tallest...Ch. 5.C - Prob. 15ECh. 5.C - Frequency Tables. Make frequency table for the...Ch. 5.C - Prob. 17ECh. 5.C - Qualitative versus Quantitative. Determine whether...Ch. 5.C - Prob. 19ECh. 5.C - Qualitative versus Quantitative. Determine whether...Ch. 5.C - Qualitative versus Quantitative. Determine whether...Ch. 5.C - Qualitative versus Quantitative. Determine whether...Ch. 5.C - 17–24: Qualitative versus Quantitative. Determine...Ch. 5.C - Qualitative versus Quantitative. Determine whether...Ch. 5.C - Binned Frequency Tables. Use the given bin sizes...Ch. 5.C - Binned Frequency Tables. Use the given bin sizes...Ch. 5.C - Largest States. Make a bar graph of the...Ch. 5.C - Prob. 28ECh. 5.C - Prob. 29ECh. 5.C - Pie Charts. Construct pie charts for the following...Ch. 5.C - Oscar-Winning Actors. The following frequcncy...Ch. 5.C - 32. Teacher Salaries. The following table shows...Ch. 5.C - 13. Cell Phone Subscriptions. The following table...Ch. 5.C - Prob. 34ECh. 5.C - Prob. 35ECh. 5.C - Prob. 36ECh. 5.C - Prob. 37ECh. 5.C - Prob. 38ECh. 5.C - Prob. 39ECh. 5.C - Prob. 40ECh. 5.C - Prob. 41ECh. 5.C - Prob. 42ECh. 5.C - Prob. 43ECh. 5.C - Alcohol-Related Motor Vehicle Fatalities. Figure...Ch. 5.C - Prob. 45ECh. 5.C - Prob. 46ECh. 5.C - Prob. 47ECh. 5.C - Prob. 48ECh. 5.C - 49. Bar Graph. Find a recent news article tha...Ch. 5.C - 50. Pie Chart. Find a recent news article that...Ch. 5.C - 51. Histogram. Find a recent news article that...Ch. 5.C - 52. Line Chart. Find a recent news article that...Ch. 5.C - 53. Making a Frequency Table. The following...Ch. 5.C - Prob. 54ECh. 5.C - Prob. 55ECh. 5.C - Prob. 56ECh. 5.C - Prob. 57ECh. 5.D - Prob. 1QQCh. 5.D - Prob. 2QQCh. 5.D - Consider Figure 5.16. According to this graph,...Ch. 5.D - Prob. 4QQCh. 5.D - Prob. 5QQCh. 5.D - Prob. 6QQCh. 5.D - Prob. 7QQCh. 5.D - Prob. 8QQCh. 5.D - 9. Consider Figure 5.22(a). Moving one tick mark...Ch. 5.D - 10. Consider Figure 5.23(a). In years where the...Ch. 5.D - Briefly describe the construction and use of...Ch. 5.D - What are geographical data? Briefly describe at...Ch. 5.D - What are three-dimensional graphics? Explain the...Ch. 5.D - What are infographics, and what is their goal?Ch. 5.D - Prob. 5ECh. 5.D - 6. What is an exponential scale? When is an...Ch. 5.D - Explain how a graph that shows percentage change...Ch. 5.D - Prob. 8ECh. 5.D - My bar chart contains more information than yours,...Ch. 5.D - 10. I used an exponential scale because the data...Ch. 5.D - Prob. 11ECh. 5.D - A graph showing the yearly rate of increase in the...Ch. 5.D - 13. Net Grain Production. Net grain production is...Ch. 5.D - Education and Earnings. Examine Figure 5.l2(a),...Ch. 5.D - 15. Education and Earnings. Examine Figure...Ch. 5.D - Gender and Test Scores. Consider the data...Ch. 5.D - Gender and Test Scores. Consider the data...Ch. 5.D - Prob. 18ECh. 5.D - College Costs Stack Plot. Answer the following...Ch. 5.D - College Degrees. Figure 5.26 shows the numbers of...Ch. 5.D - Federal Spending. Figure 5.27 shows the major...Ch. 5.D - Melanoma Mortality. Figure 5.28 shows the female...Ch. 5.D - Contour Maps. Consider the contour map in Figure...Ch. 5.D - Prob. 24ECh. 5.D - Prob. 25ECh. 5.D - Prob. 26ECh. 5.D - Prob. 27ECh. 5.D - Three-DimensionaI Pies. The pie charts in Figure...Ch. 5.D - Prob. 29ECh. 5.D - Prob. 30ECh. 5.D - Cell Phone Users. The following table shows the...Ch. 5.D - Prob. 32ECh. 5.D - World Population. Recast the population data in...Ch. 5.D - Prob. 34ECh. 5.D - HIV Distribution. Figure 5.36 displays the wealth...Ch. 5.D - Creating Graphics. Make a graphical display of the...Ch. 5.D - Prob. 37ECh. 5.D - Prob. 38ECh. 5.D - 36-40: Creating Graphics. Make a graphical display...Ch. 5.D - Prob. 40ECh. 5.D - Prob. 41ECh. 5.D - Prob. 42ECh. 5.D - Prob. 43ECh. 5.D - Prob. 44ECh. 5.D - Prob. 45ECh. 5.D - 46. Interactive Infographics. Find a few examples...Ch. 5.E - If X is correlated with Y, a. X causes Y. b....Ch. 5.E - Prob. 2QQCh. 5.E - If the points on a scatterplot fall on a nearly...Ch. 5.E - If the points on a scatterplot fall into a broad...Ch. 5.E - When can you rule out the possibility that changes...Ch. 5.E - What type of correlation would you expect between...Ch. 5.E - You have found a higher rate of birth defects...Ch. 5.E - Based on the data in Figure 5.38, abou how much...Ch. 5.E - Which of the following statements best describes...Ch. 5.E - A finding by a jury that a pcrson is guilty...Ch. 5.E - What is a correlation? Give three examples of...Ch. 5.E - What is a scatterplot, and how is one made? How...Ch. 5.E - Prob. 3ECh. 5.E - Describe the three general categories of...Ch. 5.E - 5. Briefly describe each of the six guidelines...Ch. 5.E - Briefly describe three levels of confidence in...Ch. 5.E - There is a strong negative correlation between the...Ch. 5.E - There is a strong positive correlation between the...Ch. 5.E - I found a nearly perfect positive correlation...Ch. 5.E - I found a nearly perfect negative correlation...Ch. 5.E - I had originally suspected that an increase in...Ch. 5.E - Prob. 12ECh. 5.E - Interpreting Scatterplots. Consider the following...Ch. 5.E - Prob. 14ECh. 5.E - Interpreting Scatterplots. Consider the following...Ch. 5.E - 13–16: Interpreting Scatterplots. Consider the...Ch. 5.E - Types of Correlation. For the following pairs of...Ch. 5.E - Types of Correlation. For the following pairs of...Ch. 5.E - Types of Correlation. For the following pairs of...Ch. 5.E - Types of Correlation. For the following pairs of...Ch. 5.E - 17–24: Types of Correlation. For the following...Ch. 5.E - Types of Correlation. For the following pairs of...Ch. 5.E - 17–24: Types of Correlation. For the following...Ch. 5.E - Types of Correlation. For the following pairs of...Ch. 5.E - Making Satterplots. Consider the following data...Ch. 5.E - Making Satterplots. Consider the following data...Ch. 5.E - Making Satterplots. Consider the following data...Ch. 5.E - Prob. 28ECh. 5.E - Making Satterplots. Consider the following data...Ch. 5.E - Making Satterplots. Consider the following data...Ch. 5.E - Federal Aid and Representation. For each of 31...Ch. 5.E - Correlation and Causality. Consider the following...Ch. 5.E - Correlation and Causality. Consider the following...Ch. 5.E - Correlation and Causality. Consider the following...Ch. 5.E - Correlation and Causality. Consider the following...Ch. 5.E - Correlation and Causality. Consider the following...Ch. 5.E - Prob. 37ECh. 5.E - 38. Identifying Causes: Headaches. You are trying...Ch. 5.E - 39. Smoking and Lung Cancer. There is a strong...Ch. 5.E - Prob. 40ECh. 5.E - Prob. 41ECh. 5.E - Prob. 42ECh. 5.E - Prob. 43ECh. 5.E - Prob. 44ECh. 5.E - Prob. 45ECh. 5.E - Prob. 46ECh. 5.E - Prob. 47ECh. 5.E - Prob. 48E

Additional Math Textbook Solutions

Find more solutions based on key concepts
Knowledge Booster
Background pattern image
Math
Learn more about
Need a deep-dive on the concept behind this application? Look no further. Learn more about this topic, subject and related others by exploring similar questions and additional content below.
Recommended textbooks for you
Text book image
Holt Mcdougal Larson Pre-algebra: Student Edition...
Algebra
ISBN:9780547587776
Author:HOLT MCDOUGAL
Publisher:HOLT MCDOUGAL
Text book image
Big Ideas Math A Bridge To Success Algebra 1: Stu...
Algebra
ISBN:9781680331141
Author:HOUGHTON MIFFLIN HARCOURT
Publisher:Houghton Mifflin Harcourt
Text book image
College Algebra (MindTap Course List)
Algebra
ISBN:9781305652231
Author:R. David Gustafson, Jeff Hughes
Publisher:Cengage Learning
Which is the best chart: Selecting among 14 types of charts Part II; Author: 365 Data Science;https://www.youtube.com/watch?v=qGaIB-bRn-A;License: Standard YouTube License, CC-BY