
Videos
Alcohol-Related Motor Vehicle Fatalities. Figure 5.11 shows the number of motor vehicle fatalities in the United States in which alcohol was involved for each year from 1982 to 2010.
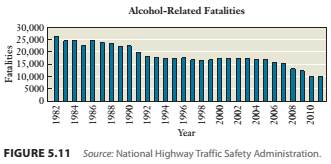
a. Approximately how many alcohol-related fatalities were there in 1982? in 2011? Comment on the overall trend over this period.
b. What is the percent change in alcohol-related fatalities over this period?
c. The total numbers of automobile fatalities in 1982 and 2011 were 43,945 and 32,367, respectively. What percentage of all fatalities an these two years involved alcohol?
d. In view of your answer to part (c), can you offer explanations for the trend in these data? Explain.
Want to see the full answer?
Check out a sample textbook solution
Chapter 5 Solutions
Using and Understanding Mathematics: A Quantitative Reasoning Approach plus NEW MyMathLab with Pearson eText -- Access Card Package (6th Edition) (Bennett Science & Math Titles)


 Glencoe Algebra 1, Student Edition, 9780079039897...AlgebraISBN:9780079039897Author:CarterPublisher:McGraw Hill
 Holt Mcdougal Larson Pre-algebra: Student Edition...AlgebraISBN:9780547587776Author:HOLT MCDOUGALPublisher:HOLT MCDOUGAL
 Algebra: Structure And Method, Book 1AlgebraISBN:9780395977224Author:Richard G. Brown, Mary P. Dolciani, Robert H. Sorgenfrey, William L. ColePublisher:McDougal Littell
 College Algebra (MindTap Course List)AlgebraISBN:9781305652231Author:R. David Gustafson, Jeff HughesPublisher:Cengage Learning
 Big Ideas Math A Bridge To Success Algebra 1: Stu...AlgebraISBN:9781680331141Author:HOUGHTON MIFFLIN HARCOURTPublisher:Houghton Mifflin Harcourt
 Functions and Change: A Modeling Approach to Coll...AlgebraISBN:9781337111348Author:Bruce Crauder, Benny Evans, Alan NoellPublisher:Cengage Learning