
Concept explainers
Videos
Missing Data; Basic CVP Concepts L06−1, L06−9
Fill in the missing amounts in each of the eight case situations below. Each case is independent of the others. (Hint: One way to find the missing amounts would be to prepare a contribution format income statement for each case, enter the known data, and then compute the missing items.)
a. Assume that only one product is being sold in each of the four following case situations: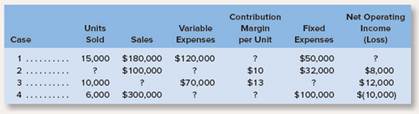
b. Assume that more than one product is being sold in each of the four following case situations: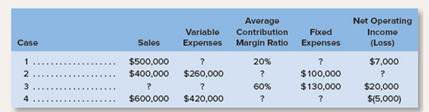
Cost volume profit analysis: Cost volume profit analysis measures the effect on income of a company with the alteration of cost and volume of sales.
The missing amount in the table.
Answer to Problem 11E
Solution:
a) Assuming that only one product is being sold in each of the following case situations:
| Case | Units Sold | Sales | Variable
Expenses | Contribution
Margin per Unit | Fixed Expenses | Net Operating Income(loss) |
| 1 | 15,000 | $180,000 | $120,000 | $4 | $50,000 | $10,000 |
| 2 | 4,000 | $100,000 | $60,000 | $10 | $32,000 | $8,000 |
| 3 | 10,000 | $200,000 | $70,000 | $13 | $118,000 | $12,000 |
| 4 | 6,000 | $300,000 | $210,000 | $15 | $100,000 | ($10,000) |
Case 1
| Contribution format income statement | ||
| Total | Per Unit | |
| Sales (15,000 units) | $180,000 | $12.00 |
| Variable expenses | $120,000 | $8.00 |
| Contribution Margin | $60,000 | $4.00 |
| Fixed expenses | $50,000 | |
| Net operating income | $10,000 | |
Case 2
| Contribution format income statement | ||
| Total | Per Unit | |
| Sales (4,000 units) | $100,000 | $25.00 |
| Variable expenses | $60,000 | $15.00 |
| Contribution Margin | $40,000 | $10.00 |
| Fixed expenses | $32,000 | |
| Net operating income | $8,000 | |
Case 3
| Contribution format income statement | ||
| Total | Per Unit | |
| Sales (10,000 units) | $200,000 | $20.00 |
| Variable expenses | $70,000 | $7.00 |
| Contribution Margin | $130,000 | $13.00 |
| Fixed expenses | $118,000 | |
| Net operating income | $12,000 | |
Case 4
| Contribution format income statement | ||
| Total | Per Unit | |
| Sales (6,000 units) | $300,000 | $50.00 |
| Variable expenses | $210,000 | $35.00 |
| Contribution Margin | $90,000 | $15.00 |
| Fixed expenses | $100,000 | |
| Net operating income | ($10,000) | |
b) Assuming that more than one product is being sold in each of the four case situations:
| Case | Sales | Variable Expenses | Average
Contribution Margin Ratio | Fixed
Expenses | Net Operating
Income (loss) |
| 1 | $500,000 | $400,000 | 20% | $93,000 | $7,000 |
| 2 | $400,000 | $260,000 | 35% | $100,000 | $40,000 |
| 3 | $250,000 | $100,000 | 60% | $130,000 | $20,000 |
| 4 | $600,000 | $420,000 | 30% | $185,000 | ($5,000) |
Case 1
| Contribution format income statement | |
| Amounts | |
| Sales | $500,000 |
| Variable expenses | $400,000 |
| Contribution Margin | $100,000 |
| Fixed expenses | $93,000 |
| Net operating income | $7,000 |
| Contribution format income statement | |
| Amounts | |
| Sales | $400,000 |
| Variable expenses | $260,000 |
| Contribution Margin | $140,000 |
| Fixed expenses | $100,000 |
| Net operating income | $40,000 |
Case 3
| Contribution format income statement | |
| Amounts | |
| Sales | $250,000 |
| Variable expenses | $100,000 |
| Contribution Margin | $150,000 |
| Fixed expenses | $130,000 |
| Net operating income | $20,000 |
Case 4
| Contribution format income statement | |
| Amounts | |
| Sales | $600,000 |
| Variable expenses | $420,000 |
| Contribution Margin | $180,000 |
| Fixed expenses | $185,000 |
| Net operating income | ($5,000) |
Explanation of Solution
A contribution margin is calculated by deducting the variable expenses from the sales revenue. So, if the variable expense is missing, the contribution margin is deducted from the sales revenue and goes same in case of units. The net operating income is calculated by deducting the fixed expenses from the contribution margin. So, if the fixed expenses are missing, the operating income is deducted from the contribution margin. The contribution margin ratio is calculated by dividing the contribution margin by sales revenue. So, if the sales revenue is missing, it can be ascertained by dividing the contribution margin by the contribution margin ratio and if the contribution margin is missing, it is calculated by multiplying the contribution margin with the contribution margin ratio.
Given: a) Assume that only one product is being sold in each of the following case situations:
| Case | Units Sold | Sales | Variable
Expenses | Contribution
Margin per Unit | Fixed Expenses | Net Operating Income(loss) |
| 1 | 15,000 | $180,000 | $120,000 | ? | $50,000 | ? |
| 2 | ? | $100,000 | ? | $10 | $32,000 | $8,000 |
| 3 | 10,000 | ? | $70,000 | $13 | ? | $12,000 |
| 4 | 6,000 | $300,000 | ? | ? | $100,000 | ($10,000) |
b) Assume that more than one product is being sold in each of the four case situations:
| Case | Sales | Variable Expenses | Average
Contribution Margin Ratio | Fixed
Expenses | Net Operating
Income (loss) |
| 1 | $500,000 | ? | 20% | ? | $7,000 |
| 2 | $400,000 | $260,000 | ? | $100,000 | ? |
| 3 | ? | ? | 60% | $130,000 | $20,000 |
| 4 | $600,000 | $420,000 | ? | ? | ($5,000) |
The cost volume profit analysis aims determining an outcome of changes in the various variables of operations. A cost is the expenses incurred on the products which are being sold and the volume is the quantity of the products which is going to be sold. The profit is the difference between the cost incurred and sales revenue of a company. An analysis of cost volume profit helps in predicting or forecasting the various consequences of various decisions.
Want to see more full solutions like this?
Chapter 6 Solutions
Introduction To Managerial Accounting
Additional Business Textbook Solutions
Fundamentals Of Cost Accounting (6th Edition)
Financial Accounting
Horngren's Financial & Managerial Accounting, The Managerial Chapters (6th Edition)
Horngren's Cost Accounting: A Managerial Emphasis (16th Edition)
Auditing And Assurance Services
Horngren's Accounting (11th Edition)


- Fill in the missing amounts in each of the eight case situations below. Each case is independent of the others. ( Hint: One way to find the missing amounts would be to prepare a contribution format income statement for each case, enter the known data, and then compute the missing items.)a. Assume that only one product is being sold in each of the four following case situations:Contribution Net OperatingUnits Variable Margin Fixed IncomeCase Sold Sales Expenses per Unit Expenses (Loss)1 .......... 15,000 $180,000 $120,000 ? $50,000 ?2 .......... ? $100,000 ? $10 $32,000 $8,0003 .......... 10,000 ? $70,000 $13 ? $12,0004 .......... 6,000 $300,000 ? ? $100,000 $(10,000)arrow_forwardMy formular function was wrong in cell C5 in contribution sheet. Please give me the right solution. Instruction: Enter a SUMIFS function into cell C5 on the Contribution worksheet that sums the Sales Revenue on the Sales and Cost Data worksheet based on the year that is entered into cell B1 on the Contribution worksheet. The data to be summed is in Column E on the Sales and Cost Data worksheet. The function should find a match in the Year column on the Sales and Cost Data worksheet to the year entered in cell B. The function should also find a match to the item in cell A5 (Sales Revenue) in Column C on the Sales and Cost Data worksheet. Add cell capacity to include Row 100 on the Sales and Cost Data worksheet.arrow_forwardBrissett Corporation makes three products that use the current constraint, which is a particular type of machine. Data concerning those products appear below: GK LQ XK Selling price per unit $ 326.11 $ 543.37 $ 519.00 Variable cost per unit $ 252.05 $ 420.86 $ 397.71 Time on the constraint (minutes) 4.00 8.00 8.00 Required: a. Rank the products in order of their current profitability from the most profitable to the least profitable. In other words, rank the products in the order in which they should be emphasized. b. Assume that sufficient constraint time is available to satisfy demand for all but the least profitable product. Up to how much should the company be willing to pay to acquire more of the constrained resource? (Round your answer to 2 decimal places.) A. GK LG QX B. Maximun Amountarrow_forward
- Brissett Corporation makes three products that use the current constraint, which is a particular type of machine. Data concerning those products appear below: GK LQ XK Selling price per unit $ 119.51 $ 226.07 $ 228.96 Variable cost per unit $ 89.87 $ 176.86 $ 178.92 Time on the constraint (minutes) 1.90 3.70 3.60 Required: A. Rank the products in order of their current profitability from the most profitable to the least profitable. In other words, rank the products in the order in which they should be emphasized. B. Assume that sufficient constraint time is available to satisfy demand for all but the least profitable product. Up to how much should the company be willing to pay to acquire more of the constrained resource?arrow_forwardFill in the missing amounts in each of the four case situations below. Each case is independent of the others. Assume that only one product is being sold in each of the four following case situations: Case Units Sold Sales Variable Expenses Contribution Margin per Unit Fixed Expenses Net Income (Loss) 1 20,000 $ 220,00 $ 140,000 $ A $ 55,000 $ B 2 C 147,000 D 8 34,000 8,000 3 15,000 E 75,000 12 F 14,000 4 8,000 320,000 G H 110,000 (30,000)arrow_forwardFalsetta Corporation makes three products that use the current constraint, which is a particular type of machine. Data concerning those products appear below: ZA JK DHSelling price per unit........................ $402.67 $462.82 $374.06Variable cost per unit....................... $307.53 $344.56 $285.56Time on the constraint (minutes) ...... 6.70 7.30 5.90 Required:a. Rank the products in order of their current profitability from the most profitable to the least profitable. In other words, rank the products in the order in which they should be emphasized. Show your work! b. Assume that sufficient constraint time is available to satisfy demand for all but the least profitable product. Up to how much should the company be willing to pay to acquire more of the constrained resource?arrow_forward
- The VARCOST2 worksheet is capable of calculating variable and absorption income when unit sales are equal to or less than production. An equally common situation (that this worksheet cannot handle) is when beginning inventory is present and sales volume exceeds production volume. Revise the worksheet Data Section to include: Beginning inventory in units 15,000 Beginning inventory cost (absorption) $266,875 Beginning inventory cost (variable) $210,000, Also, change actual production to 70,000. Revise the Answer Section to accommodate this new data. Assume that Anderjak uses the weighted-average costing method for inventory. Preview the printout to make sure that the worksheet will print neatly on one page, and then print the worksheet. Check figure: Absorption income, $670,000.arrow_forwardThe end product J is made from components K, L, and M. K is made from N and O. O is made from P and Q. What is the gross requirement for Q if the company plans to build 10 of its J model? Assume that there are no beginning inventories. 60 360 10 120 30arrow_forwardFollowing information is related to Product X of Zempa Company: Current replacement cost $230 Cost to distribute $42 Historical cost Normal profit margin Selling price $215 $36 $245 If lower-of-cost-or-market rule (LCM Rule) is applied, then the value of Product X that would be reported in the balance sheet is: a.arrow_forward
- Swifty Company gathered the following data about the three products that it produces: Product PresentSales Value Estimated AdditionalProcessing Costs Estimated Salesif Processed Further A $10200 $7100 $18300 B 12200 4100 15300 C 9200 2100 13300 Which of the products should not be processed further? Product B Product A Product C Products A and Carrow_forwardFixed costs are 35% of the cost of goods sold and 14% of the selling and administrative expenses. Suffolk China Ware assumes that fixed costs would not be significantly affected if the Cups line were discontinued. a. Prepare a differential analysis report for all three products. b. Which of the following statements about the Cups line is true?arrow_forwardLittle Cory Corporation is considering dropping product G41O. Data from the company's accounting system appear below: All fixed expenses of the company are fully allocated to products in the company's accounting system. Further investigation has revealed that $117,000 of the fixed manufacturing expenses and $46,000 of the fixed selling and administrative expenses are avoidable if product G41O is discontinued.Required:a. According to the company's accounting system, what is the net operating income earned by product G41O? b. What would be the effect on the company's overall net operating income of dropping product G41O? Should the product be dropped? There is not a word length requirement for this question; however, you must show your work. sales 450,000 variable expenses 185,000 fixesd manufacturing expenses 149,000 fixed selling and administered expenses 113,000arrow_forward
 Survey of Accounting (Accounting I)AccountingISBN:9781305961883Author:Carl WarrenPublisher:Cengage Learning