
Concept explainers
(a)
Time mean speed.
Answer to Problem 1P
The time mean speed is
Explanation of Solution
Given:
Observers stationed at two sections XX and YY, 500 ft apart on a highway, recording the time of vehicles on their arrival as shown in the accompanying table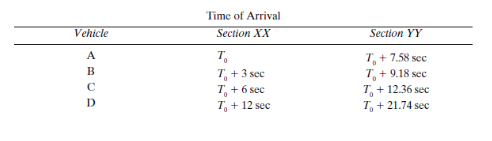
The total time of observation at XX was 15 sec.
In order to calculate time mean speed, we need to figure out traveling time of each vehicle which is the difference of time taken by a vehicle in travelling from XX to YY section between the two sections.
Calculation:
| Vehicles | Section XX | Section YY | Travelling time of vehicle, |
| A | | | |
| B | | | |
| C | | | |
| D | | | |
We have the following formula for the time mean speed:
Where,
n is the number of the vehicles passing.
Now, the speed of the individual vehicles is as follows:
Speed of vehicle A:
Speed of vehicle B:
Speed of vehicle C:
Speed of vehicle D:
Now, the time mean speed can be calculated by substituting the values in the following formula:
Conclusion:
Therefore, the time mean speed is
(b)
Space mean speed.
Answer to Problem 1P
The time mean speed is
Explanation of Solution
Given:
Observers stationed at two sections XX and YY, 500 ft apart on a highway, recording the time of vehicles on their arrivalas shown in the accompanying table.

The total time of observation at XX was 15 sec.
Calculation:
We have the following formula for finding out the space mean speed.
Where,
Substitute the values, we have:
Conclusion:
Therefore, the time mean speed is
(c)
Flow at section XX.
Answer to Problem 1P
The flow at section XX is as follows
Explanation of Solution
Given:
Observers stationed at two sections XX and YY, 500 ft apart on a highway, recording the time of vehicles on their arrival as shown in the accompanying table.

The total time of observation at XX was 15 sec.
Calculation:
We have the following formula for finding out the flow at XX section.
Where,
Substitute the values, we have:
Conclusion:
Therefore, the flow at section XX is as follows
Want to see more full solutions like this?
Chapter 6 Solutions
Traffic and Highway Engineering


- Two sets of students are collecting traffic data at two sections, xx and yy, of a highway 1500 ft apart. Observations at xx show that five vehicles passed that section at intervals of 3, 4, 3, and 5 sec, respectively. If the speeds of the vehicles were 50, 45, 40, 35, and 30 mi/h, respectively, draw a schematic showing the locations of the vehicles 20 sec after the first vehicles passed section xx. Also, determine (a) the time mean speed, (b) the space mean speed, and (c) the density on the highway.arrow_forward1. There are 3 vehicles observed in a 100 m section of McArthur highway. If the average time headway is 4 sec., compute the space mean speed of the vehicles in kph. 2. Three cars travel over a 60 m. section of highway at constant speeds of 19, 20 and 25 m/s. Compute the time mean speed for this condition in m/s (two decimal places 3. If the density of traffic in Aurora Blvd. is 25 veh/km and the average headway is 4 sec., compute the space mean speed in kpharrow_forwardCompute the rate of flow in veh/hr if the space mean speed is 35 mph and the density of traffic is 17 veh/km a.959 veh/hr b.956 veh/hr c.957 veh/hr d.958 veh/hrarrow_forward
- Assume you are an observer standing at a point along a three‐lane roadway. All vehicles in lane 1 are traveling at 30 mi/hr, all vehicles in lane 2 are traveling at 45 mi/hr, and all vehicles in lane 3 are traveling at 60 mi/hr. The spacing between vehicles in each lane is 0.5 mile. If you collect spot speed data for all vehicles as they cross your observation point for 2 hours, what will be the time‐mean speed and space‐mean speed for this traffic stream?arrow_forwardTraffic volume count has been collected on a 2- lane road section which needs upgradation due to severe traffic flow condition. Maximum service flow rate per lane is observed as 1280 veh/h at level of service 'C'. The Peak Hour Factor is reported as 0.78125. Historical traffic volume count provides Annual Average Daily Traffic as 12270 veh/day. Directional split of the traffic flow is observed to be 60: 40. Assuming that traffic stream consists of 'All Cars' and all drivers are 'Regular Commuters', the number of extra lane(s) (round off to the next higher integer) to be provided, isarrow_forwardThe Data below shows the result of the flow of traffic at a certain part of a highway by observing the arrival times for four vehicles at two sections A and B that are 150 m apart. the total observation time at section A is 15 sec. determine the flow at section A.arrow_forward
- A traffic data has been collected on two points on a highway: Point A and Point B, 450m apart. Observations at Point A shows that five vehicles passed the location at intervals 5, 5, 3, and 3 sec respectively. The speed of the vehicles at point A are 61, 59, 70, 79, 55 km/hr respectively. Assume the speed is maintained until point B. What is the density, in veh/km.arrow_forward1. Compute the rate of flow in vehicles per hour (two-decimal places) if the space mean speed is 30 mph and the density is 14 vehicles per km. 2. The spacing of the cars moving along the same lane of an expressway is 40 m center to center. If the average velocity of the car is 60 kph, determine the volume of traffic in veh/hr. 3. In a given instant, there were 2400 vehicles counted at a specific point along the portion of the TPLEX. The highway was designed to have a capacity of 3000 veh/hr with a free-flow speed of 60 kph. Compute the maximum value of the jam density in veh/km that could possibly occur during heavy traffic assuming linear speed-density relationship appliesarrow_forwardAssume you are an observer standing at a point along a three lane roadway. All vehicles in lane 1 are traveling at 50 km/h, all vehicles in lane 2 are traveling at 75 km/h, and all vehicles in lane 3 are traveling at 100 km/h. There is also a constant spacing of 0.8 kilometer between vehicles. If you collect spot speed data for all vehicles as they cross your observation point, for 30 minutes, what will be the time mean speed and space mean speed for this traffic stream?arrow_forward
- Data obtained from aerial photography showed nine vehicles on a 720 ft-long section of road. Traffic data collected at the same time indicated an average time headway of 4.2 sec. Determine the following. (a) the density on the highway (in veh/mi) veh/mi (b) the flow on the road (in veh/h) veh/h (c) the space mean speed (in mi/h) mi/harrow_forwardSix vehicles were observed passing a point for every 25 sec. the density of traffic is 30 veh/km. Find the space mean speed.arrow_forwardA traffic stream display average vehicle time headway of 2 sec at space mean speed 60 km/hr compute average space headway, flow rate and density for traffic stream?arrow_forward
 Traffic and Highway EngineeringCivil EngineeringISBN:9781305156241Author:Garber, Nicholas J.Publisher:Cengage Learning