Concept explainers
Videos
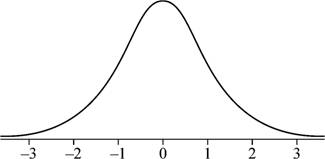
To sketch: The graph showing the shape of the distribution of the bone mineral density test scores.
Answer to Problem 1RE
The shape of the distribution of the bone mineral density test scores is shown below.
Explanation of Solution
Given info:
The bone density test scores follow a
Justification:
Here, the bone density test follows a normal distribution. Also, the graph of the normal distribution is bell shaped and is symmetric about the mean. Moreover, if the mean and standard deviation are 0 and 1, respectively, the distribution is known as standard normal distribution. Hence, the graph of the bone density test scores is bell-shaped
Want to see more full solutions like this?
Chapter 6 Solutions
Elementary Statistics Using Excel Plus NEW MyLab Statistics with Pearson eText -- Title-Specific Access Card Package (6th Edition)


 MATLAB: An Introduction with ApplicationsStatisticsISBN:9781119256830Author:Amos GilatPublisher:John Wiley & Sons Inc
 Probability and Statistics for Engineering and th...StatisticsISBN:9781305251809Author:Jay L. DevorePublisher:Cengage Learning
 Statistics for The Behavioral Sciences (MindTap C...StatisticsISBN:9781305504912Author:Frederick J Gravetter, Larry B. WallnauPublisher:Cengage Learning
 Elementary Statistics: Picturing the World (7th E...StatisticsISBN:9780134683416Author:Ron Larson, Betsy FarberPublisher:PEARSON
 The Basic Practice of StatisticsStatisticsISBN:9781319042578Author:David S. Moore, William I. Notz, Michael A. FlignerPublisher:W. H. Freeman
 Introduction to the Practice of StatisticsStatisticsISBN:9781319013387Author:David S. Moore, George P. McCabe, Bruce A. CraigPublisher:W. H. Freeman