
Videos
Core Skill: Modeling The goal of this modeling challenge is to draw a graph showing a different relationship between ecosystem function and species richness, one based on the rivet hypothesis, which was proposed in 1981.
Modeling Challenge: In 1981, Paul and Ann Ehrlich proposed a relationship between ecosystem function and species richness called the rivet hypothesis. In this model, species are like the rivets on an airplane. Some species play a small but critical role in keeping the plane, the ecosystem, airborne, while other species do not, and we cannot tell beforehand which species affect the ecosystem function the most. The loss of a single rivet will probably not weaken the plane. However, the loss of few rivets would impair airworthiness. The plane could still function but not at maximum efficiency. Continuing on, the loss of a few more rivets could again be tolerated, but the loss of yet more rivets would prove critical to the airplane’s function. Thus, ecosystem function declines with decreased species richness in a stepwise fashion. Draw a graph that depicts a model for the rivet hypothesis. Use the same format as those in Figure 60.2.
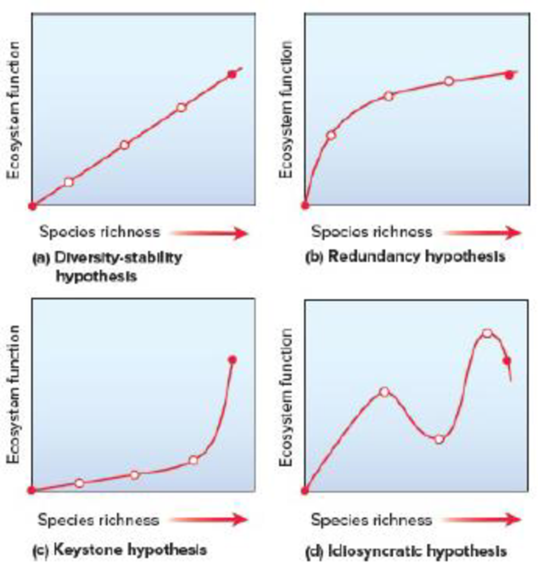
Figure 60.2 Graphical representations of possible relationships between ecosystem function and species richness. The two solid dots represent the end points of a continuum of species richness. The first dot is at the origin, where there are no species and no community services. The second dot represents a natural level of species richness. The relationship is strongest in (a) and weakest in (d).
Want to see the full answer?
Check out a sample textbook solution
Chapter 60 Solutions
Biology


- Q No 5. Could you explain the interrelationship of organisms in an ecosystem in detail? Draw figures or diagrams where required.arrow_forwardDescribe the San Francisco Estuary Project. How has population growth in the San Francisco Bay Area affected the estuary? How has the habitat fracture in the San Francisco Estuary been increased by human behavior? How is the project focusing on maintaining the biodiversity of plants and animals in the San Francisco Estuary?arrow_forwardLab 5. Integrated Pest Management (IPM) Go to the following website: http://ipm.ucanr.edu and answer the questions bellow: What is IPM? How does it work? Define: Biological control Cultural controls Mechanical and physical controls Chemical control Describe IPM for one agricultural pest: https://www2.ipm.ucanr.edu/agriculture/, choose a crop, go to Insects and Mites, and choose one insect or mite, then provide with the following information: Name the crop Name and describe a pest Describe the pest damage Describe the pest management including: Biological Control Cultural Control Organically Acceptable Methods Example: http://ipm.ucanr.edu/PMG//r1300611.html Crop Alfalfa Pest Alfalfa Caterpillar Scientific Name: Colias eurytheme Description of the Pest The yellow or white butterflies of the alfalfa caterpillar lay eggs on the new growth of alfalfa that is less than 6 inches tall. Eggs hatch into green caterpillars in 3 to 7 days. Full-grown…arrow_forward
- Question:- The speckled warbler is a small, declining, woodland bird that is restricted to intact forest and woodland areas Speckled warblers are sensitive to fragmentation and declining patch size. Of the metrics: spatial configuration, connectivity, and proximity index (IP); which ones would you consider to be most useful in describing the suitability of each landscape for the Speckled warbler? What other factors might you consider when selecting metrics to describe habitat suitably?arrow_forwardMake a diagram showing the link between biodiversity and climate change. Include relevant terms and concepts from all the learning materials provided to you in this module. Synthesize the connections and interrelationship of the two topics. Your output may be generated through MS word smart art graphics or any graphic design tools. Then, write an explanation on another sheet of paper.arrow_forwardWhat term describes the use of mathematical equations in the modeling of linear aspects of ecosystems? analytical modeling simulation modeling conceptual modeling individual-based modelingarrow_forward
- Visual Skills If you were an ecologist studying the chemical andphysical limits to the distributions of species, how might you rearrange theflowchart preceding this question?arrow_forwardEcoystem Stability Practice 1) Explain how the stability of the ecosystem changes from the healthy left side to the unhealthy right side. 2) Make a claim as to whether the right side could ever “heal.” 3) Justify your claim with evidence and scientific reasoning from this lesson and your prior learning.arrow_forwardCreate a new thread in your Learning Team Forumentitled “Ecosystem Topic Selection.” QUESTION TITLE :- BIO 101 Week 4 Learning Team Assignment Food Web Diagram Ecosystem Topic Selectionarrow_forward
- Identify one environmental problem. Diagram all the fields of specialization needed and state research questions they need to answer in proposing a solution to that problem. A sample diagram is attach for your guidancearrow_forwardQuestion: The figure below shows the relative abundance (y axis) of shrubs in an ecosystem in the years following a fire (x axis). The shrubs in this ecosystem fall into two functional groups: fire recruiters and fire persisters. If fire frequency increased significantly in this ecosystem, which group would be benefited? Choose one of the option below A- Both functional groups would benefit equally B- Fire persister species C- Fire recruiter speciesarrow_forwardhttps://www.biointeractive.org/classroom-resources/exploring-trophic-cascades create a case study based on additional research into other examples of trophic cascades. describe and illustrate how changes in an organismal population can have unintended effects on trophic levels or ecosystems. Identify the organisms and nutrients (if applicable) that are present in your trophic pyramid. Describe the normal flow of your trophic cascade along with whether removal or introduction of the organism has a positive or negative effect on other organisms or nutrient levels within an ecosystem.arrow_forward
 Biology 2eBiologyISBN:9781947172517Author:Matthew Douglas, Jung Choi, Mary Ann ClarkPublisher:OpenStax