Understanding Basic Statistics
8th Edition
ISBN: 9781337558075
Author: Charles Henry Brase, Corrinne Pellillo Brase
Publisher: Cengage Learning
bartleby

Concept explainers

bartleby

Videos

Textbook Question
Book Icon
Chapter 6.1, Problem 13P

Fishing: Trout The following data are based on information taken from Daily Creel Summary, published by the Paiute Indian Nation. Pyramid Lake. Nevada. Movie stars and U.S. presidents have fished Pyramid Lake. It is one of the best places in the lower 48 states to catch trophy cutthroat trout. In this table, x = number of fish caught in a 6-hour period. The percentage data are the percentages of fishermen who catch x fish in a 6-hour period while fishing from shore.

X 0 1 2 3 4 or more
% 44% 36% 15% 4% 1%

(a) Convert the percentages to probabilities and make a histogram of the probability distribution.

(b) Find the probability that a fisherman selected at random fishing from shore catches one or more fish in a 6-hour period.

(c) Find the probability that a fisherman selected at random fishing from shore catches two or more fish in a 6-hour period.

(d) Compute μ , the expected value of the number of fish caught per fisherman in a 6-hour period (round 4 or more to 4).

(c) Compute σ , the standard deviation of the number of fish caught per fisherman in a 6-hour period (round 4 or more to 4).

(a)

Expert Solution
Check Mark
To determine

The provided percentage in terms of probability and histogram.

Answer to Problem 13P

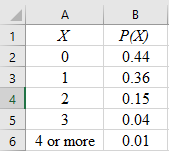
Solution: The table that shows the percentage in terms of probability is shown below:

x 0 1 2 3 4 or more
P(x) 0.44 0.36 0.15 0.04 0.01

Explanation of Solution

Given: The following table is given as:

x 0 1 2 3 4 or more
Percentage 44% 36% 15% 4% 1%

Calculation: The percentage can be converted into probability by dividing the percentage by 100.

For x=0, the probability is:

Probability = 44100=0.44

Similarly, the probabilities for the values of x=1,2,3,4 can be obtained. The obtained probabilities are shown below in the form of a table:

x 0 1 2 3 4 or more
P(x) 0.44 0.36 0.15 0.04 0.01

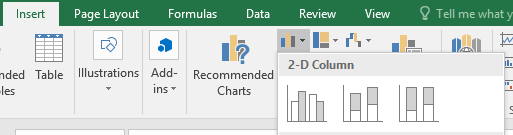
To graph the data, follow the steps given below in MS Excel:

Step 1: Enter the data into an MS Excel sheet. The screenshot is given below:

Understanding Basic Statistics, Chapter 6.1, Problem 13P , additional homework tip  1

Step 2: Select the data and click on ‘Insert’. Go to ‘charts’ and select the ‘Clustered Column’ option as the chart type.

Understanding Basic Statistics, Chapter 6.1, Problem 13P , additional homework tip  2

Step 3: Select the first plot and click the ‘add chart element’ option that is provided in the left-hand corner of the menu bar. Insert the ‘Chart title’. The histogram for the provided data is shown below.

Understanding Basic Statistics, Chapter 6.1, Problem 13P , additional homework tip  3

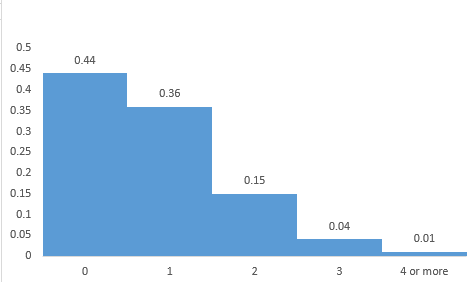
Interpretation: It can be seen that the histogram has a long right tail. So, it is skewed to the right.

(b)

Expert Solution
Check Mark
To determine

The probability that a fisherman who selected fishes at random from the shore, catches one or more fish in a 6-hour period.

Answer to Problem 13P

Solution: The probability is 0.56.

Explanation of Solution

Given: The probability distribution table is given below:

x 0 1 2 3 4 or more
P(x) 0.44 0.36 0.15 0.04 0.01

Calculation: The probability that a fisherman who selected fishes at random from the shore, catches one or more fish in a 6-hour period can be obtained by:

P(1or more)=1P(0)

According to the probability distribution table, the value of the probability P(0) is 0.44. Thus,

P(1or more)=1P(0)=10.44=0.56

Interpretation: There is a 56% chance of selecting the fishes at random from the shore, catches one or more fish in a 6-hour period.

(c)

Expert Solution
Check Mark
To determine

The probability that a fisherman who selected fishes from the shore, catches two or more fish in a 6-hour period.

Answer to Problem 13P

Solution: The probability is 0.20.

Explanation of Solution

Given: The probability distribution table is given below:

x 0 1 2 3 4 or more
P(x) 0.44 0.36 0.15 0.04 0.01

Calculation: The probability that that a fisherman who selected fishes at random from the shore catches two or more fish in a 6-hour period can be obtained by:

P(2or more)=P(2)+P(3)+P(4or more)

According to the probability distribution table, the probabilities- P(2), P(3), and P(4 or more) are 0.15, 0.04, and 0.01 respectively. Thus,

P(2or more)=P(2)+P(3)+P(4or more)=0.15+0.04+0.01=0.20

Interpretation: There is a 20% chance of selecting the fishes at random from the shore, catches two or more fish in a 6-hour period.

(d)

Expert Solution
Check Mark
To determine

The expected value ‘μ’.

Answer to Problem 13P

Solution: The expected value ‘μ’ is 0.82.

Explanation of Solution

Given: The probability distribution table is given below:

x 0 1 2 3 4 or more
P(x) 0.44 0.36 0.15 0.04 0.01

Calculation: The formula to calculate the expected value is:

μ=ixip(xi)

Here, xi is the random variable and p(xi) is its corresponding probability. Substitute the values in the above formula. Thus:

μ=xP(x)=0×(0.44)+1×(0.36)+2×(0.15)+3×(0.04)+4×(0.01)=0.82

Hence, the expected value is 0.82.

(e)

Expert Solution
Check Mark
To determine

The standard deviation ‘σ’ of the number of fishes caught per fisherman in a 6-hour period.

Answer to Problem 13P

Solution: The standard deviation ‘σ’ is 0.8986.

Explanation of Solution

Given: The probability distribution table is given below:

x 0 1 2 3 4 or more
P(x) 0.44 0.36 0.15 0.04 0.01

Calculation: The formula to calculate the standard deviation is:

σ=(xμ)2P(x)

Here, μ is the expected value and P(x) is the probability. Substitute the values in the above formula:

σ=(00.82)2(0.44)+(10.82)2(0.36)+(20.82)2(0.15)+(30.82)2(0.04)+(3.18)2(0.01)=0.295856+0.011664+0.20886+0.19009+0.10112=0.8076=0.8986

Hence, the standard deviation is 0.899.

Want to see more full solutions like this?

Subscribe now to access step-by-step solutions to millions of textbook problems written by subject matter experts!

Chapter 6 Solutions

Understanding Basic Statistics

Ch. 6.1 - Marketing: Income What is the income distribution...Ch. 6.1 - History: Florence Nightingale What was the age...Ch. 6.1 - Fishing: Trout The following data are based on...Ch. 6.1 - Criminal Justice: Parole USA Today reported that...Ch. 6.1 - Fundraiser: Hiking Club The college hiking club is...Ch. 6.1 - Spring Break: Caribbean Cruise The college student...Ch. 6.1 - Expected Value: Life Insurance Jim is a...Ch. 6.1 - Expected Value: Life Insurance Sara is a...Ch. 6.1 - Expand Your Knowledge: Linear Functions and...Ch. 6.1 - Expand Your Knowledge: Linear Functions and...Ch. 6.1 - Expand Your Knowledge: Linear Functions and...Ch. 6.2 - Statistical Literacy What does the random variable...Ch. 6.2 - Statistical Literacy What does it mean to say that...Ch. 6.2 - Statistical Literacy For a binomial experiment,...Ch. 6.2 - Statistical Literacy In a binomial experiment, is...Ch. 6.2 - Interpretation Suppose you are a hospital manager...Ch. 6.2 - Interpretation From long experience a landlord...Ch. 6.2 - Critical Thinking In an experiment, there are n...Ch. 6.2 - Critical Thinking In a carnival game, there are...Ch. 6.2 - Critical Thinking According to the college...Ch. 6.2 - Critical Thinking: Simulation Central Eye Clinic...Ch. 6.2 - In each of the following problems, the binomial...Ch. 6.2 - In each of the following problems, the binomial...Ch. 6.2 - In each of the following problems, the binomial...Ch. 6.2 - In each of the following problems, the binomial...Ch. 6.2 - In each of the following problems, the binomial...Ch. 6.2 - In each of the following problems, the binomial...Ch. 6.2 - In each of the following problems, the binomial...Ch. 6.2 - In each of the following problems, the binomial...Ch. 6.2 - In each of the following problems, the binomial...Ch. 6.2 - In each of the following problems, the binomial...Ch. 6.2 - Psychology: Deceit Aldrich Ames is a convicted...Ch. 6.2 - Hardware Store: Income Trevor is interested in...Ch. 6.2 - Psychology: Myers-Briggs Approximately 75% of all...Ch. 6.2 - Business Ethics: Privacy Are your finances, buying...Ch. 6.2 - Business Ethics: Privacy According to the same...Ch. 6.2 - Health Care: Office Visits What is the age...Ch. 6.2 - Binomial Distribution Table: Symmetry Study the...Ch. 6.3 - Statistical Literacy What does the expected value...Ch. 6.3 - Statistical Literacy Consider two binomial...Ch. 6.3 - Basic Computation: Expected Value and Standard...Ch. 6.3 - Basic Computation: Expected Value and Standard...Ch. 6.3 - Critical Thinking Consider a binomial distribution...Ch. 6.3 - Criticai Thinking Consider a binomial distribution...Ch. 6.3 - Binomial Distribution: Histograms Consider a...Ch. 6.3 - Binomial Distributions: Histograms Figure 6-6...Ch. 6.3 - Critical Thinking Consider a binomial distribution...Ch. 6.3 - Critical Thinking Consider a binomial distribution...Ch. 6.3 - Sports: Surfing In Hawaii, January is a favorite...Ch. 6.3 - Quality Control: Syringes The quality-control...Ch. 6.3 - Private Investigation: Locating People Old Friends...Ch. 6.3 - Ecology: Hawaiian Tsunamis A tidal wave or tsunami...Ch. 6.3 - Education: Illiteracy USA Today reported that...Ch. 6.3 - Rude Drivers: Tailgating Do you tailgate the car...Ch. 6.3 - Criminal Justice: ParoleUSA Today reports that...Ch. 6.3 - Criminal Justice: Jury Duty Have you ever tried to...Ch. 6.3 - Law Enforcement: Property Crime Does crime pay ?...Ch. 6.3 - Focus Problem: Personality Types We now have the...Ch. 6.3 - Criminal Justice: Convictions Innocent until...Ch. 6.3 - Critical Thinking Let r be a binomial random...Ch. 6.3 - Expand Your Knowledge: Geometric Probability...Ch. 6.3 - Expand Your Knowledge: Geometric Distribution;...Ch. 6.3 - Expand Your Knowledge: Geometric Distribution;...Ch. 6 - Terminology Consider the data set consisting of...Ch. 6 - Terminology Consider the data set consisting of...Ch. 6 - Terminology Which quantity is give by the expected...Ch. 6 - Terminology Consider the following statements...Ch. 6 - Statistical Literacy What are the requirements for...Ch. 6 - Statistical Literacy List the criteria for a...Ch. 6 - Critical Thinking For a binomial probability...Ch. 6 - Critical Thinking Consider a binomial experiment....Ch. 6 - Probability Distribution: Auto Leases Consumer...Ch. 6 - Ecology: Predator and Prey Isle Royale. an island...Ch. 6 - Insurance: Auto State Farm Insurance studies show...Ch. 6 - Quality Control: Pens A stationery store has...Ch. 6 - Criminal Justice: Inmates According to Harper's...Ch. 6 - Airlines: On-Time ArrivalsConsumer Reports rated...Ch. 6 - Ecology: Shark Attacks In Hawaii shark attacks are...Ch. 6 - Restaurants: Reservations The Orchard Caf has...Ch. 6 - College Lire: Student Government The student...Ch. 6 - Although tables of binomial probabilities can be...Ch. 6 - Prob. 2UTACh. 6 - Although tables of binomial probabilities can be...Ch. 6 - Prob. 4UTACh. 6 - Although tables of binomial probabilities can be...Ch. 6 - Although tables of binomial probabilities can be...Ch. 6 - Prob. 7UTACh. 6 - The Hill of Tara is located in south-central...Ch. 6 - Prob. 2CRPCh. 6 - Prob. 3CRPCh. 6 - The Hill of Tara is located in south-central...Ch. 6 - The Hill of Tara is located in south-central...Ch. 6 - The Hill of Tara is located in south-central...Ch. 6 - The Hill of Tara is located in south-central...
Knowledge Booster
Background pattern image
Statistics
Learn more about
Need a deep-dive on the concept behind this application? Look no further. Learn more about this topic, statistics and related others by exploring similar questions and additional content below.
Recommended textbooks for you
Text book image
Holt Mcdougal Larson Pre-algebra: Student Edition...
Algebra
ISBN:9780547587776
Author:HOLT MCDOUGAL
Publisher:HOLT MCDOUGAL
Text book image
Glencoe Algebra 1, Student Edition, 9780079039897...
Algebra
ISBN:9780079039897
Author:Carter
Publisher:McGraw Hill
Text book image
Algebra & Trigonometry with Analytic Geometry
Algebra
ISBN:9781133382119
Author:Swokowski
Publisher:Cengage
Text book image
Big Ideas Math A Bridge To Success Algebra 1: Stu...
Algebra
ISBN:9781680331141
Author:HOUGHTON MIFFLIN HARCOURT
Publisher:Houghton Mifflin Harcourt
Area Between The Curve Problem No 1 - Applications Of Definite Integration - Diploma Maths II; Author: Ekeeda;https://www.youtube.com/watch?v=q3ZU0GnGaxA;License: Standard YouTube License, CC-BY