Elementary Statistics: A Step By Step Approach
9th Edition
ISBN: 9780073534985
Author: Allan Bluman
Publisher: McGraw-Hill Science/Engineering/Math
bartleby

Concept explainers

bartleby

Videos

Textbook Question
Book Icon
Chapter 6.1, Problem 1AC

Many times in statistics it is necessary to see if a set of data values is approximately normally distributed. There are special techniques that can be used. One technique is to draw a histogram for the data and see if it is approximately bell-shaped. (Note: It does not have to be exactly symmetric to be bellshaped.)

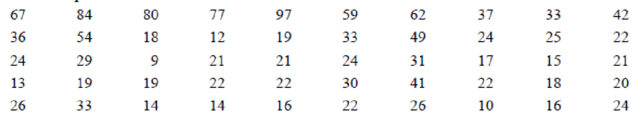
The numbers of branches of the 50 top banks are shown.

Chapter 6.1, Problem 1AC, Many times in statistics it is necessary to see if a set of data values is approximately normally

1. Construct a frequency distribution for the data.

2. Construct a histogram for the data.

3. Describe the shape of the histogram.

4. Based on your answer to question 3, do you feel that the distribution is approximately normal?

In addition to the histogram, distributions that are approximately normal have about 68% of the values fall within 1 standard deviation of the mean, about 95% of the data values fall within 2 standard deviations of the mean, and almost 100% of the data values fall within 3 standard deviations of the mean. (See Figure 6–5.)

5. Find the mean and standard deviation for the data.

6. What percent of the data values fall within 1 standard deviation of the mean?

7. What percent of the data values fall within 2 standard deviations of the mean?

8. What percent of the data values fall within 3 standard deviations of the mean?

9. How do your answers to questions 6, 7, and 8 compare to 68, 95, and 100%, respectively?

10. Does your answer help support the conclusion you reached in question 4? Explain.

1.

Expert Solution
Check Mark
To determine

To construct: The frequency distribution for the data.

Answer to Problem 1AC

The frequency distribution for the data is,

Limits Frequency
0-9 1
10-19 14
20-29 17
30-39 7
40-49 3
50-59 2
60-69 2
70-79 1
80-89 2
90-99 1

Explanation of Solution

Given info:

The data shows that the number of branches of the 50 top banks.

Calculation:

Answers may vary; one of the possible answers is given below.

First consider the limits with the difference of 9.

The limits are 0-9, 10-19, 20-29, 30-39, 40-49, 50-59, 60-69, 70-79, 80-89 and 90-99.

From the data, it can be observed that the number banks having branches between 0-9 is 1. Also, the number banks having branches between 10-19 is 14.

Similarly, the frequencies of other classes are obtained as follows.

Limits Frequency
0-9 1
10-19 14
20-29 17
30-39 7
40-49 3
50-59 2
60-69 2
70-79 1
80-89 2
90-99 1

2.

Expert Solution
Check Mark
To determine

To construct: The histogram for the data.

Answer to Problem 1AC

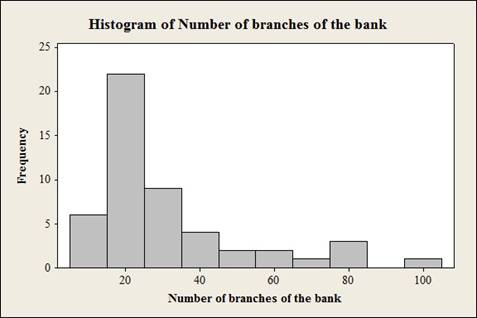
The histogram for the data is,

Elementary Statistics: A Step By Step Approach, Chapter 6.1, Problem 1AC , additional homework tip  1

Explanation of Solution

Calculation:

Step-by-step procedure to obtain histogram using the MINITAB software:

  • Choose Graph > Histogram.
  • Choose Simple, and then click OK.
  • In Graph variables, enter the column of Number of branches of the bank.
  • Click OK.

3.

Expert Solution
Check Mark
To determine

To describe: The shape of the histogram.

Answer to Problem 1AC

The shape of the histogram is unimodel and skewed to the right.

Explanation of Solution

Justification:

From the histogram of part (2), it can be observed that the data has single group and the bar in histogram starts with a high value which is gradually decreasing to the minimum value. Thus, it can be conclude that shape of the histogram is unimodel and skewed to the right.

4.

Expert Solution
Check Mark
To determine

To check: Whether the distribution is approximately normal or not based on the answer of question 3.

Answer to Problem 1AC

No, the distribution is not approximately normal.

Explanation of Solution

Justification:

From the part (3), it can be observed shape of the histogram is unimodel and skewed to the right. Thus, it can be conclude that the distribution does not appear to be normal.

5.

Expert Solution
Check Mark
To determine

To find: The mean and standard deviation for the data.

Answer to Problem 1AC

The mean and standard deviation for the data are 31.4 and 20.6.

Explanation of Solution

Calculation:

  • Choose Stat > Basic Statistics > Display Descriptive Statistics.
  • In Variables enter the columns Variable.
  • Choose option statistics, and select Mean and Standard deviation.
  • Click OK.

Output using Minitab software is,

Elementary Statistics: A Step By Step Approach, Chapter 6.1, Problem 1AC , additional homework tip  2

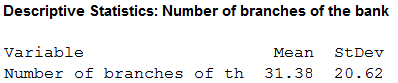
Form the Minitab output, it can be observed that the mean and standard deviation for the data are approximately 31.4 and 20.6.

6.

Expert Solution
Check Mark
To determine

To find: The percent of the data values fall within 1 standard deviation of the mean.

Answer to Problem 1AC

The percent of the data values fall within 1 standard deviation of the mean is 80%.

Explanation of Solution

Calculation:

Here, 1 standard deviation of the mean represents that μ±σ .

Substitute 31.4 for μ and 20.6 for σ

For μσ :

μσ=31.420.6=10.8

For μ+σ :

μ+σ=31.4+20.6=52

The percentage of the data values fall within 1 standard deviation of the mean represents the percentage of the data values lies between 10.8 and 52.

The formula for the percentage of the data values fall within 1 standard deviation of the mean is,

Percentage=Number of data values lies within 10.8 and 52Total number of data values×100

Substitute 40 for “Number of data values lies within 10.8 and 52” and 50 for “Total number of data values”

Percentage=4050×100=80

Thus, the percent of the data values fall within 1 standard deviation of the mean is 80%.

7.

Expert Solution
Check Mark
To determine

To find: The percent of the data values fall within 2 standard deviation of the mean.

Answer to Problem 1AC

The percent of the data values fall within 2 standard deviation of the mean is 92%.

Explanation of Solution

Calculation:

Here, 2 standard deviation of the mean represents that μ±2σ .

Substitute 31.4 for μ and 20.6 for σ

For μ2σ :

μ2σ=31.42×20.6=9.8

For μ+2σ :

μ+2σ=31.4+2×20.6=72.6

The percentage of the data values fall within 2 standard deviation of the mean represents the percentage of the data values lies between –9.8 and 72.6.

The formula for the percentage of the data values fall within 2 standard deviation of the mean is,

Percentage=Number of data values lies within 9.8 and 72.6Total number of data values×100

Substitute 46 for “Number of data values lies within –9.8 and 72.6” and 50 for “Total number of data values”

Percentage=4650×100=92

Thus, the percent of the data values fall within 2 standard deviation of the mean is 92%.

8.

Expert Solution
Check Mark
To determine

To find: The percent of the data values fall within 3 standard deviation of the mean.

Answer to Problem 1AC

The percent of the data values fall within 3 standard deviation of the mean is 98%.

Explanation of Solution

Calculation:

Here, 3 standard deviation of the mean represents that μ±3σ .

Substitute 31.4 for μ and 20.6 for σ

For μ3σ :

μ3σ=31.43×20.6=30.4

For μ3σ :

μ+3σ=31.4+3×20.6=93.2

The percentage of the data values fall within 3 standard deviation of the mean represents the percentage of the data values lies between –30.4 and 93.2.

The formula for the percentage of the data values fall within 3 standard deviation of the mean is,

Percentage=Number of data values lies within 30.4 and 93.2Total number of data values×100

Substitute 49 for “Number of data values lies within –30.4 and 93.2” and 50 for “Total number of data values”

Percentage=4950×100=98

Thus, the percent of the data values fall within 3 standard deviation of the mean is 98%.

9.

Expert Solution
Check Mark
To determine

To compare: The 6,7 and 8 answers with the 68, 95 and 100%.

Answer to Problem 1AC

The 6,7 and 8 answers are different with the 68, 95 and 100%.

Explanation of Solution

Calculation:

From the answers of 6,7 and 8, it is observed that the percent of the data values fall within 1,2 and 3 standard deviation of the mean are 80%, 92% and 98%. Thus, it can be conclude that the 6,7 and 8 answers are different with the 68, 95 and 100%.

10.

Expert Solution
Check Mark
To determine

To explain: Whether the answer help to support the conclusion in question 4.

Answer to Problem 1AC

Yes, the answer help to support the conclusion in question 4 because the distribution of the variable does not follow normal distribution.

Explanation of Solution

Calculation:

From the answer of (9), it can be observed that the distribution of the variable does not follow normal distribution. Thus, it can be concluding that the answer help to support the conclusion in question 4.

Want to see more full solutions like this?

Subscribe now to access step-by-step solutions to millions of textbook problems written by subject matter experts!

Chapter 6 Solutions

Elementary Statistics: A Step By Step Approach

Ch. 6.1 - For Exercises 7 through 26, find the area under...Ch. 6.1 - Prob. 11ECh. 6.1 - For Exercises 7 through 26, find the area under...Ch. 6.1 - Prob. 13ECh. 6.1 - For Exercises 7 through 26, find the area under...Ch. 6.1 - For Exercises 7 through 26, find the area under...Ch. 6.1 - For Exercises 7 through 26, find the area under...Ch. 6.1 - Prob. 17ECh. 6.1 - For Exercises 7 through 26, find the area under...Ch. 6.1 - For Exercises 7 through 26, find the area under...Ch. 6.1 - For Exercises 7 through 26, find the area under...Ch. 6.1 - Prob. 21ECh. 6.1 - For Exercises 7 through 26, find the area under...Ch. 6.1 - Prob. 23ECh. 6.1 - For Exercises 7 through 26, find the area under...Ch. 6.1 - For Exercises 7 through 26, find the area under...Ch. 6.1 - For Exercises 7 through 26, find the area under...Ch. 6.1 - Prob. 27ECh. 6.1 - In Exercises 27 through 40, find the probabilities...Ch. 6.1 - Prob. 29ECh. 6.1 - In Exercises 27 through 40, find the probabilities...Ch. 6.1 - Prob. 31ECh. 6.1 - In Exercises 27 through 40, find the probabilities...Ch. 6.1 - Prob. 33ECh. 6.1 - In Exercises 27 through 40, find the probabilities...Ch. 6.1 - In Exercises 27 through 40, find the probabilities...Ch. 6.1 - In Exercises 27 through 40, find the probabilities...Ch. 6.1 - Prob. 37ECh. 6.1 - In Exercises 27 through 40, find the probabilities...Ch. 6.1 - In Exercises 27 through 40, find the probabilities...Ch. 6.1 - In Exercises 27 through 40, find the probabilities...Ch. 6.1 - For Exercises 41 through 46, find the z value that...Ch. 6.1 - For Exercises 41 through 46, find the z value that...Ch. 6.1 - For Exercises 41 through 46, find the z value that...Ch. 6.1 - For Exercises 41 through 46, find the z value that...Ch. 6.1 - For Exercises 41 through 46, find the z value that...Ch. 6.1 - For Exercises 41 through 46, find the z value that...Ch. 6.1 - Find the z value to the left of the mean so that...Ch. 6.1 - Find the z value to the right of the mean so that...Ch. 6.1 - Find two z values, one positive and one negative,...Ch. 6.1 - Find two z values so that 48% of the middle area...Ch. 6.1 - Prob. 51ECCh. 6.1 - Prob. 52ECCh. 6.1 - Prob. 53ECCh. 6.1 - For Exercises 5356, z0 is the statistical notation...Ch. 6.1 - Prob. 55ECCh. 6.1 - Prob. 56ECCh. 6.1 - Prob. 57ECCh. 6.1 - Prob. 58ECCh. 6.1 - Prob. 59ECCh. 6.1 - Find P(z 2.3 and z 1.2).Ch. 6.2 - Applying the Concepts 62 Smart People Assume you...Ch. 6.2 - Prob. 1ECh. 6.2 - Teachers Salaries The average annual salary for...Ch. 6.2 - Population in U.S. Jails The average daily jail...Ch. 6.2 - SAT Scores The national average SAT score (for...Ch. 6.2 - Chocolate Bar Calories The average number of...Ch. 6.2 - Monthly Mortgage Payments The average monthly...Ch. 6.2 - Prob. 7ECh. 6.2 - Doctoral Student Salaries Full-time Ph.D. students...Ch. 6.2 - Miles Driven Annually The mean number of miles...Ch. 6.2 - Commute Time to Work The average commute to work...Ch. 6.2 - Credit Card Debt The average credit card debt for...Ch. 6.2 - Prob. 12ECh. 6.2 - Prob. 13ECh. 6.2 - Newborn Elephant Weights Newborn elephant calves...Ch. 6.2 - Prob. 15ECh. 6.2 - Salary of Full Professors The average salary of a...Ch. 6.2 - Prob. 17ECh. 6.2 - Itemized Charitable Contributions The average...Ch. 6.2 - New Home Sizes A contractor decided to build homes...Ch. 6.2 - New-Home Prices If the average price of a new...Ch. 6.2 - Cost of Personal Computers The average price of a...Ch. 6.2 - Reading Improvement Program To help students...Ch. 6.2 - Prob. 23ECh. 6.2 - Ages of Amtrak Passenger Cars The average age of...Ch. 6.2 - Lengths of Hospital Stays The average length of a...Ch. 6.2 - High School Competency Test A mandatory competency...Ch. 6.2 - Product Marketing An advertising company plans to...Ch. 6.2 - Prob. 28ECh. 6.2 - Wristwatch Lifetimes The mean lifetime of a...Ch. 6.2 - Police Academy Acceptance Exams To qualify for a...Ch. 6.2 - In the distributions shown, state the mean and...Ch. 6.2 - SAT Scores Suppose that the mathematics SAT scores...Ch. 6.2 - Prob. 33ECh. 6.2 - Standardizing If a distribution of raw scores were...Ch. 6.2 - Social Security Payments Consider the distribution...Ch. 6.2 - Find the Mean In a normal distribution, find when...Ch. 6.2 - Internet Users U.S. internet users spend an...Ch. 6.2 - Exam Scores An instructor gives a 100-point...Ch. 6.2 - Drive-in Movies The data shown represent the...Ch. 6.2 - Prob. 40ECh. 6.2 - Prob. 41ECh. 6.2 - Prob. 42ECh. 6.2 - Prob. 43ECh. 6.3 - Applying the Concepts 63 Times To Travel to School...Ch. 6.3 - Prob. 1ECh. 6.3 - Why do most of the sample means differ somewhat...Ch. 6.3 - What is the mean of the sample means?Ch. 6.3 - What is the standard deviation of the sample means...Ch. 6.3 - What does the central limit theorem say about the...Ch. 6.3 - What formula is used to gain information about an...Ch. 6.3 - Prob. 7ECh. 6.3 - Glass Garbage Generation A survey found that the...Ch. 6.3 - Prob. 9ECh. 6.3 - Teachers Salaries in Connecticut The average...Ch. 6.3 - Prob. 11ECh. 6.3 - Teachers Salaries in North Dakota The average...Ch. 6.3 - Prob. 13ECh. 6.3 - SAT Scores The national average SAT score (for...Ch. 6.3 - Cost of Overseas Trip The average overseas trip...Ch. 6.3 - Cell Phone Lifetimes A recent study of the...Ch. 6.3 - Water Use The Old Farmers Almanac reports that the...Ch. 6.3 - Medicare Hospital Insurance The average yearly...Ch. 6.3 - Amount of Laundry Washed Each Year Procter Gamble...Ch. 6.3 - Per Capita Income of Delaware Residents In a...Ch. 6.3 - Prob. 21ECh. 6.3 - Systolic Blood Pressure Assume that the mean...Ch. 6.3 - Cholesterol Content The average cholesterol...Ch. 6.3 - Ages of Proofreaders At a large publishing...Ch. 6.3 - TIMSS Test On the Trends in International...Ch. 6.3 - Life Expectancies In a study of the life...Ch. 6.3 - Home Values A study of 800 homeowners in a certain...Ch. 6.3 - Breaking Strength of Steel Cable The average...Ch. 6.3 - Prob. 29ECCh. 6.3 - Prob. 30ECCh. 6.4 - Applying the Concepts 64 Mountain Climbing Safety...Ch. 6.4 - Explain why a normal distribution can be used as...Ch. 6.4 - What conditions must be met to use the normal...Ch. 6.4 - Why is a correction for continuity necessary?Ch. 6.4 - When is the normal distribution not a good...Ch. 6.4 - Prob. 5ECh. 6.4 - Prob. 6ECh. 6.4 - Check each binomial distribution to see whether it...Ch. 6.4 - Check each binomial distribution to see whether it...Ch. 6.4 - Prob. 9ECh. 6.4 - School Enrollment Of all 3- to 5-year-old...Ch. 6.4 - Home Ownership In a recent year, the rate of U.S....Ch. 6.4 - Mail Order A mail order company has an 8% success...Ch. 6.4 - Prob. 13ECh. 6.4 - Prob. 14ECh. 6.4 - Prob. 15ECh. 6.4 - Population of College Cities College students...Ch. 6.4 - Prob. 17ECh. 6.4 - Prob. 18ECh. 6.4 - Female Americans Who Have Completed 4 Years of...Ch. 6.4 - Prob. 20ECh. 6.4 - Elementary School Teachers Women comprise 80.3% of...Ch. 6.4 - Prob. 22ECh. 6.4 - Prob. 23ECCh. 6 - Prob. 6.1.1RECh. 6 - Find the area under the standard normal...Ch. 6 - Prob. 6.1.3RECh. 6 - Using the standard normal distribution, find each...Ch. 6 - Per Capita Spending on Health Care The average per...Ch. 6 - Prob. 6.2.6RECh. 6 - Commuter Train Passengers On a certain run of a...Ch. 6 - Monthly Spending for Paging and Messaging Services...Ch. 6 - Cost of Smartphone Repair The average cost of...Ch. 6 - Prob. 6.2.10RECh. 6 - Private Four-Year College Enrollment A random...Ch. 6 - Heights of Active Volcanoes The heights (in feet...Ch. 6 - Confectionary Products Americans ate an average of...Ch. 6 - Average Precipitation For the first 7 months of...Ch. 6 - Sodium in Frozen Food The average number of...Ch. 6 - Prob. 6.3.16RECh. 6 - Retirement Income Of the total population of...Ch. 6 - Slot Machines The probability of winning on a slot...Ch. 6 - Multiple-Job Holders According to the government,...Ch. 6 - Enrollment in Personal Finance Course In a large...Ch. 6 - Prob. 6.4.21RECh. 6 - Larceny-Thefts Excluding motor vehicle thefts, 26%...Ch. 6 - Determine whether each statement is true or false....Ch. 6 - Prob. 2CQCh. 6 - Determine whether each statement is true or false....Ch. 6 - The z value corresponding to a number below the...Ch. 6 - Determine whether each statement is true or false....Ch. 6 - Prob. 6CQCh. 6 - Select the best answer. 7. The mean of the...Ch. 6 - Approximately what percentage of normally...Ch. 6 - Which is not a property of the standard normal...Ch. 6 - When a distribution is positively skewed, the...Ch. 6 - Prob. 11CQCh. 6 - Complete the following statements with the best...Ch. 6 - The difference between a sample mean and a...Ch. 6 - The mean of the sample means equals ________.Ch. 6 - The standard deviation of all possible sample...Ch. 6 - The normal distribution can be used to approximate...Ch. 6 - Prob. 17CQCh. 6 - Find the area under the standard normal...Ch. 6 - Using the standard normal distribution, find each...Ch. 6 - Amount of Rain in a City The average amount of...Ch. 6 - Heights of People The average height of a certain...Ch. 6 - Sports Drink Consumption The average number of...Ch. 6 - Years to Complete a Graduate Program The average...Ch. 6 - Passengers on a Bus On the daily run of an express...Ch. 6 - Thickness of Library Books The average thickness...Ch. 6 - Prob. 26CQCh. 6 - Prob. 27CQCh. 6 - Electric Bills The average electric bill in a...Ch. 6 - Sleep Survey According to a recent survey, 38% of...Ch. 6 - Prob. 30CQCh. 6 - Household Online Connection The percentage of U.S....Ch. 6 - Prob. 32CQCh. 6 - Prob. 33CQCh. 6 - GMAT Scores The average GMAT scores for the top-30...Ch. 6 - Prob. 1CTCCh. 6 - Sometimes a researcher must decide whether a...Ch. 6 - Prob. 3CTCCh. 6 - Prob. 4CTCCh. 6 - Sometimes a researcher must decide whether a...Ch. 6 - Prob. 6CTCCh. 6 - Prob. 7CTCCh. 6 - Prob. 8CTCCh. 6 - Formulas Confirm the two formulas hold true for...

Additional Math Textbook Solutions

Find more solutions based on key concepts
Knowledge Booster
Background pattern image
Statistics
Learn more about
Need a deep-dive on the concept behind this application? Look no further. Learn more about this topic, statistics and related others by exploring similar questions and additional content below.
Recommended textbooks for you
Text book image
Glencoe Algebra 1, Student Edition, 9780079039897...
Algebra
ISBN:9780079039897
Author:Carter
Publisher:McGraw Hill
The Shape of Data: Distributions: Crash Course Statistics #7; Author: CrashCourse;https://www.youtube.com/watch?v=bPFNxD3Yg6U;License: Standard YouTube License, CC-BY
Shape, Center, and Spread - Module 20.2 (Part 1); Author: Mrmathblog;https://www.youtube.com/watch?v=COaid7O_Gag;License: Standard YouTube License, CC-BY
Shape, Center and Spread; Author: Emily Murdock;https://www.youtube.com/watch?v=_YyW0DSCzpM;License: Standard Youtube License