
Probability and Statistics for Engineering and the Sciences
9th Edition
ISBN: 9781305251809
Author: Jay L. Devore
Publisher: Cengage Learning
expand_more
expand_more
format_list_bulleted
Concept explainers
Videos
Textbook Question
Chapter 6.1, Problem 6E
Urinary angiotensinogen (AGT) level is one quantitative indicator of kidney
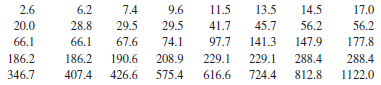
An appropriate probability plot supports the use of the lognormal distribution (see Section 4.5) as a reasonable model for urinary AGT level (this is what the investigators did).
- a. Estimate the parameters of the distribution. [Hint. Remember that X has a lognormal distribution with parameters μ and σ2 if ln(X) is
normally distributed with mean μ and variance σ2.] - b. Use the estimates of part (a) to calculate an estimate of the
expected value of AGT level. [Hint: What is E(X)?]
Expert Solution & Answer

Trending nowThis is a popular solution!

Students have asked these similar questions
Low-Birth-Weight Hospital Stays. Data on low-birthweight babies were collected over a 2-year period by 14 participating centers of the National Institute of Child Health and Human Development Neonatal Research Network. Results were reported by J. Lemons et al. in the on-line paper “Very Low Birth Weight Outcomes of the National Institute of ChildHealth and Human Development Neonatal Research Network” (Pediatrics, Vol. 107, No. 1, p. e1). For the 1084 surviving babies whose birth weights were 751– 1000 grams, the average length of stay in the hospital was 86 days, although one center had an average of 66 days and another had an average of 108 days.
a. Can the mean lengths of stay be considered population means? Explain your answer.b. Assuming that the population standard deviation is 12 days, determine the z-score for a baby’s length of stay of 86 days at the center where the mean was 66 days.c. Assuming that the population standard deviation is 12 days, determine the z-score for a…
A Canadian study measuring depression level in teens (as reported in the Journal of Adolescence, vol. 25, 2002) randomly sampled 112 male teens and 101 female teens, and scored them on a common depression scale (higher score representing more depression). The researchers suspected that the mean depression score for male teens is higher than for female teens, and wanted to check whether data would support this hypothesis.
What conclusion can you draw from the output?
The data provide sufficient evidence to reject H0 and to conclude that the mean depression score for male teens is larger than that of female teens.
The data provide sufficient evidence to conclude that male and female teens do not differ in mean depression score.
The data do not provide sufficient evidence to conclude that the mean depression score of male teens is larger than that of female teens.
The data do not provide sufficient evidence to reject H0, so we accept it, and conclude that male and female teens do…
Stressed-Out Bus Drivers. Previous studies have shown that urban bus drivers have an extremely stressful job, and a large proportion of drivers retire prematurely with disabilities due to occupational stress. In the paper, “Hassles on the Job: A Study of a Job Intervention With Urban Bus Drivers” (Journal of Organizational Behavior, Vol. 20, pp. 199–208), G. Evans et al. examined the effects of an intervention program to improve the conditions of urban bus drivers.Amongother variables, the researchers monitored diastolic blood pressure of bus drivers in downtown Stockholm, Sweden. The data, in millimeters of mercury (mm Hg), on the WeissStats site are based on the blood pressures obtained prior to intervention for the 41 bus drivers in the study. Use the technology of your choice to do the following.
a. Obtain a normal probability plot, boxplot, histogram, and stemand-leaf diagram of the data.
b. Based on your results from part (a), can you reasonably apply the one-mean t-test to the…
Chapter 6 Solutions
Probability and Statistics for Engineering and the Sciences
Ch. 6.1 - The accompanying data on flexural strength (MPa)...Ch. 6.1 - The National Health and Nutrition Examination...Ch. 6.1 - Consider the following sample of observations on...Ch. 6.1 - The article from which the data in Exercise 1 was...Ch. 6.1 - As an example of a situation in which several...Ch. 6.1 - Urinary angiotensinogen (AGT) level is one...Ch. 6.1 - a. A random sample of 10 houses in a particular...Ch. 6.1 - In a random sample of 80 components of a certain...Ch. 6.1 - Each of 150 newly manufactured items is examined...Ch. 6.1 - Using a long rod that has length , you are going...
Ch. 6.1 - Of n1 randomly selected male smokers, X1 smoked...Ch. 6.1 - Suppose a certain type of fertilizer has an...Ch. 6.1 - Consider a random sample X1,..., Xn from the pdf...Ch. 6.1 - A sample of n captured Pandemonium jet fighters...Ch. 6.1 - Let X1, X2,..., Xn represent a random sample from...Ch. 6.1 - Suppose the true average growth of one type of...Ch. 6.1 - In Chapter 3, we defined a negative binomial rv as...Ch. 6.1 - Let X1, X2,..., Xn be a random sample from a pdf...Ch. 6.1 - An investigator wishes to estimate the proportion...Ch. 6.2 - A diagnostic test for a certain disease is applied...Ch. 6.2 - Let X have a Weibull distribution with parameters ...Ch. 6.2 - Let X denote the proportion of allotted time that...Ch. 6.2 - Let X represent the error in making a measurement...Ch. 6.2 - A vehicle with a particular defect in its emission...Ch. 6.2 - The shear strength of each of ten test spot welds...Ch. 6.2 - Consider randomly selecting n segments of pipe and...Ch. 6.2 - Let X1,..., Xn be a random sample from a gamma...Ch. 6.2 - Prob. 28ECh. 6.2 - Consider a random sample X1, X2,, Xn from the...Ch. 6.2 - At time t = 0, 20 identical components are tested....Ch. 6 - An estimator is said to be consistent if for any ...Ch. 6 - a. Let X1,.., Xn be a random sample from a uniform...Ch. 6 - At time t = 0, there is one individual alive in a...Ch. 6 - The mean squared error of an estimator is MSE ()...Ch. 6 - Prob. 35SECh. 6 - When the population distribution is normal, the...Ch. 6 - When the sample standard deviation S is based on a...Ch. 6 - Each of n specimens is to be weighed twice on the...
Knowledge Booster


Learn more about
Need a deep-dive on the concept behind this application? Look no further. Learn more about this topic, statistics and related others by exploring similar questions and additional content below.Similar questions
- Is Seat Belt Use Independent of Cigarette Smoking?A study of seat belt users and nonusers yielded the randomly selected sample data summarized in the given table (based on data from “What Kinds of People Do Not Use Seat Belts?” by Helsing and Comstock,American Journal of Public Health,Vol. 67, No. 11). Test the claim that the amount of smoking is independent of seat belt use. A plausible theory is that people who smoke more are less concerned about their health and safety and are therefore less inclined to wear seat belts. Is this theory supported by the sample data?arrow_forwardDexamethasone and IQ. In the paper “Outcomes at School Age After Postnatal Dexamethasone Therapy for Lung Disease of Prematurity” (New England Journal of Medicine, Vol. 350, No. 13, pp. 1304–1313), T. Yeh et al. studied the outcomes at school age in children who had participated in a double-blind, placebo-controlled trial of early postnatal dexamethasone therapy for the prevention of chronic lung disease of prematurity. All of the infants in the study had had severe respiratory distress syndrome requiring mechanical ventilation shortly after birth. On the WeissStats site, we provide the school-age IQs of the 74 children in the control group, based on the study results. Use the technology of your choice to do the following. a. Obtain a normal probability plot, boxplot, histogram, and stemand-leaf diagram of the data. b. Based on your results from part (a), can you reasonably apply one-standard-deviation χ2-procedures to the data? Explain your reasoning. c. Overall, IQs of school-age…arrow_forwardIs Echinacea Effective for Colds? Rhinoviruses typically cause common colds. In a test of the effectiveness of echinacea, 40 of the 45 subjects treated with echinacea developed rhi-novirus infections. In a placebo group, 88 of the 103 subjects developed rhinovirus infections (based on data from “An Evaluation of Echinacea Angustifolia in Experimental Rhinovirus Infections,” by Turner et al., New England Journal of Medicine, Vol. 353, No. 4). We want to use a 0.05 significance level to test the claim that echinacea has an effect on rhinovirus infections. a. Test the claim using a hypothesis test. b. Test the claim by constructing an appropriate confidence interval. c. Based on the results, does echinacea appear to have any effect on the infection rate?arrow_forward
- The article “Dynamics of Insulin Action in Hypertension: Assessment from Minimal ModelInterpretation of Intravenous Glucose Tolerance Test Data” (R. Burattini, M. Morettini, etal., Med Biol Eng Comput, 2011:831–841) compared levels of an insulin sensitivity index SIin patients with high blood pressure and patients with normal blood pressure. Ten patientswith high blood pressure had a mean value of 3.4 with a standard deviation of 0.6, and eightpatients with normal blood pressure had a mean value of 7.9 with a standard deviation of0.6. Units are 10−5 · min−1 · pmol−1. Find a 98% confidence interval for the difference inmean levels between those with high blood pressure and those with normal blood pressure.arrow_forwardHigh levels of blood sugar are associated with an increased risk of type 2 diabetes. A levelhigher than normal is referred to as “impaired fasting glucose.” The article “Association ofLow-Moderate Arsenic Exposure and Arsenic Metabolism with Incident Diabetes andInsulin Resistance in the Strong Heart Family Study” (M. Grau-Perez, C. Kuo, et al.,Environmental Health Perspectives, 2017, online) reports a study in which 47 of 155 peoplewith impaired fasting glucose had type 2 diabetes. Consider this to be a simple randomsample. a) Find a 95% confidence interval for the proportion of people with impaired fasting glucose who have type 2 diabetes. b) Find a 99% confidence interval for the proportion of people with impaired fasting glucose who have type 2 diabetes. c) A doctor claims that less than 35% of people with impaired fasting glucose have type 2 diabetes. With what level of confidence can this claim be made?arrow_forwardAn article23 summarized results from the Nurses’ Health Study and the Health Pro- fessionals Follow-Up Study. The article reported (with RR = relative risk) that “Com- pared with nonregular use, regular aspirin use was associated with lower risk of overall cancer (RR 0.97; 95% CI 0.94, 0.99), which was primarily due to a lower incidence of gastrointestinal cancers, especially colorectal cancers (RR 0.81; 95% CI 0.75, 0.88).” Identify the response variables and the explanatory variable for these two results. Explain how to interpret the confidence interval about colorectal cancers. Would the association with overall cancer be considered (i) significant or non- significant? (ii) strong or weak? Explain. question 1 and 2arrow_forward
- Lactation promotes a temporary loss of bone mass to provide adequate amounts of calcium for milk production. The paper “Bone Mass Is Recovered from Lactation to Postweaning in Adolescent Mothers with Low Calcium Intakes” (Amer. J. of Clinical Nutr., 2004: 1322–1326) gave the following data on total body bone mineral content (TBBMC) (g) for a sample both during lactation (L) and in the postweaning period (P). SubjectL 1928 2549 2825 1924 1628 2175 2114 2621 1843 2541P 2126 2885 2895 1942 1750 2184 2164 2626 2006 2627 Does the data suggest that true average total body bone mineral content during postweaning exceeds that during lactation by more than 25 g? State and test the appropriate hypotheses using a significance level of .05.arrow_forwardLeisure Activities and Dementia. An article appearing in the Los Angeles Times discussed the study “Leisure Activities and the Risk of Dementia in the Elderly” (New England Journal of Medicine, Vol. 348) by J.Verghese et al. The article in the Times, titled “Crosswords Reduce Risk of Dementia,” contained the following statement: “Elderly people who frequently read, do crossword puzzles, practice a musical instrument or play board games cut their risk of Alzheimer’s and other forms of dementia by nearly two-thirds compared with people who seldom do such activities.” Comment on thestatement in quotes, keeping in mind the type of study for which causation can be reasonably inferred.arrow_forwardA case–control study of patients on antihypertensive drugs related an increased risk of myocardial infarction (MI) for patients using calcium channel blockers (Psaty, et al.,1995). In this study, cases were antihypertensive drug patients who had suffered a first fatal or nonfatal MI through 1993, and controls were antihypertensive patients, matched by demographic factors, who had not suffered a MI. Among the comparisons reported were patients receiving calcium channel (CC) blockers (with and without diuretics) and patients receiving β–blockers (with and without diuretics). Results of numbers of patient by drug/MI status combination are given in Table 1. Compute the odds ratio of suffering MI (CC blockers relative to β–blockers), and the corresponding 95% CI. Does it appear that calcium channel blockers are associated with higher odds (and thus probability) of suffering MI than β –blockers? Table 1: Observed cell counts for antihypertensive drug/MI data Occurrence of…arrow_forward
- Cadmium, a heavy metal, is toxic to animals. Mushrooms, however, are able to absorb and accumulate cadmium at high concentrations. The Czech and Slovak governments have set a safety limit for cadmium in dry vegetables at 0.5 part per million (ppm). M. Melgar et al. measured the cadmium levels in a random sample of the edible mushroom Boletus pinicola and published the results in the paper “Influence of Some Factors in Toxicity and Accumulation of Cd from Edible Wild Macrofungi in NW Spain” (Journal of Environmental Science and Health, Vol. B33(4), pp. 439–455). A hypothesis test is to be performed to decide whether the mean cadmium level in Boletus pinicola mushrooms is greater than the government’s recommended limit. Hypothesis tests are proposed. For each hypothesis test,a. determine the null hypothesis.b. determine the alternative hypothesis.c. classify the hypothesis test as two tailed, left tailed, or right tailed.arrow_forwardDid the authors note any differences in gender with regard to fish consumption and inflammatory markers? What does this result mean? When compared with the non-fish consumers, those who consumed >300 g of fish per week had on average ____% lower CRP. Was this result significant? How do you know? What was the value of Amyloid A (mg/dl) for the group that made up the largest percentage of the sample? How much fish did this group consume? Do the study findings have implications for health care? If so what are they? Provide a rationale for your answer.arrow_forwardThe National Transportation Safety Board wants to look at the safety of three different sizes of cars. Using the data below, determine the whether the mean pressure applied to the driver`s head during a crash is equal for each type of car at alpha = 0.01 Compact cars Midsize cars Full-size Cars 643 469 484 655 427 456 702 525 402 a) Ho: Ha : b) Decision c) Conclusionarrow_forward
arrow_back_ios
SEE MORE QUESTIONS
arrow_forward_ios
Recommended textbooks for you
 MATLAB: An Introduction with ApplicationsStatisticsISBN:9781119256830Author:Amos GilatPublisher:John Wiley & Sons Inc
 Probability and Statistics for Engineering and th...StatisticsISBN:9781305251809Author:Jay L. DevorePublisher:Cengage Learning
 Statistics for The Behavioral Sciences (MindTap C...StatisticsISBN:9781305504912Author:Frederick J Gravetter, Larry B. WallnauPublisher:Cengage Learning
 Elementary Statistics: Picturing the World (7th E...StatisticsISBN:9780134683416Author:Ron Larson, Betsy FarberPublisher:PEARSON
 The Basic Practice of StatisticsStatisticsISBN:9781319042578Author:David S. Moore, William I. Notz, Michael A. FlignerPublisher:W. H. Freeman
 Introduction to the Practice of StatisticsStatisticsISBN:9781319013387Author:David S. Moore, George P. McCabe, Bruce A. CraigPublisher:W. H. Freeman
MATLAB: An Introduction with Applications
Statistics
ISBN:9781119256830
Author:Amos Gilat
Publisher:John Wiley & Sons Inc
Probability and Statistics for Engineering and th...
Statistics
ISBN:9781305251809
Author:Jay L. Devore
Publisher:Cengage Learning
Statistics for The Behavioral Sciences (MindTap C...
Statistics
ISBN:9781305504912
Author:Frederick J Gravetter, Larry B. Wallnau
Publisher:Cengage Learning
Elementary Statistics: Picturing the World (7th E...
Statistics
ISBN:9780134683416
Author:Ron Larson, Betsy Farber
Publisher:PEARSON
The Basic Practice of Statistics
Statistics
ISBN:9781319042578
Author:David S. Moore, William I. Notz, Michael A. Fligner
Publisher:W. H. Freeman
Introduction to the Practice of Statistics
Statistics
ISBN:9781319013387
Author:David S. Moore, George P. McCabe, Bruce A. Craig
Publisher:W. H. Freeman
Mod-01 Lec-01 Discrete probability distributions (Part 1); Author: nptelhrd;https://www.youtube.com/watch?v=6x1pL9Yov1k;License: Standard YouTube License, CC-BY
Discrete Probability Distributions; Author: Learn Something;https://www.youtube.com/watch?v=m9U4UelWLFs;License: Standard YouTube License, CC-BY
Probability Distribution Functions (PMF, PDF, CDF); Author: zedstatistics;https://www.youtube.com/watch?v=YXLVjCKVP7U;License: Standard YouTube License, CC-BY
Discrete Distributions: Binomial, Poisson and Hypergeometric | Statistics for Data Science; Author: Dr. Bharatendra Rai;https://www.youtube.com/watch?v=lHhyy4JMigg;License: Standard Youtube License