
Videos
A tire company claims that the lifetimes of its tires average 50,000 miles. The standard deviation of tire lifetimes is known to be 5000 miles. You sample 100 tires and will test the hypothesis that the mean tire lifetime is at least 50,000 miles against the alternative that it is less. Assume, in fact, that the true mean lifetime is 49,500 miles.
- a. State the null and alternate hypotheses. Which hypothesis is true?
- b. It is decided to reject H0 if the sample mean is less than 49,400. Find the level and power of this test.
- c. If the test is made at the 5% level, what is the power?
- d. At what level should the test be conducted so that the power is 0.80?
- e. You are given the opportunity to sample more tires. How many tires should be sampled in total so that the power is 0.80 if the test is made at the 5% level?
a.
State the null and alternate hypotheses and also identify which hypothesis is true.
Explanation of Solution
Given info:
A tire company claims that the lifetimes of its tires average 50,000 miles. The standard deviation of tire lifetimes is 5,000 miles.
Assume that the true mean lifetime is 49,500 miles.
Justification:
State the null and alternate hypotheses.
Null hypothesis:
That is, the mean tire lifetime is at least 50,000 miles.
Alternative hypothesis:
That is, the mean tire lifetime is less than 50,000 miles.
The alternative hypothesis,
b.
Find the level and power of the test.
Answer to Problem 5E
The level is 0.1151.
The power is 0.4207.
Explanation of Solution
Calculation:
Type-1 error: Rejecting the null hypothesis
Under
The level is calculated as follows:
Software Procedure:
Step-by-step procedure to obtain the
- Choose Graph > Probability Distribution Plot choose View Probability > OK.
- From Distribution, choose ‘Normal’ distribution.
- Click the Shaded Area tab.
- Choose X Value and Left Tail for the region of the curve to shade.
- Enter the data value as -1.2.
- Click OK.
Output using the MINITAB software is given below:
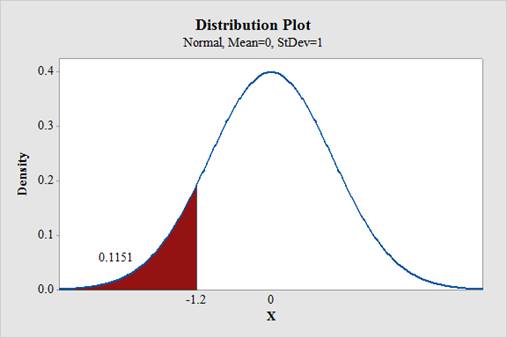
From the output,
Therefore, the level is 0.1151.
Power:
The probability of rejecting a null hypothesis when it is false is called the power of the test.
Software Procedure:
Step-by-step procedure to obtain the
- Choose Graph > Probability Distribution Plot choose View Probability > OK.
- From Distribution, choose ‘Normal’ distribution.
- Click the Shaded Area tab.
- Choose X Value and Left Tail for the region of the curve to shade.
- Enter the data value as -0.2.
- Click OK.
Output using the MINITAB software is given below:
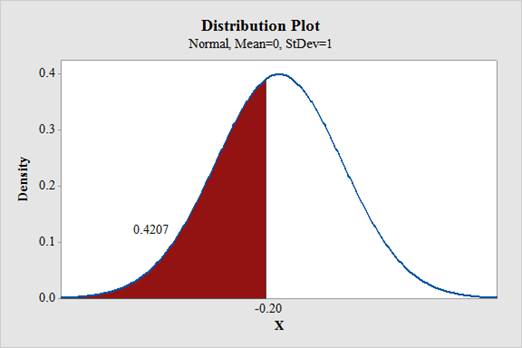
From the output,
Thus, the power is 0.4207.
c.
Find the power of the test.
Answer to Problem 5E
The power is 0.2578.
Explanation of Solution
Calculation:
The 5% rejection region is
5th percentile:
Software Procedure:
Step-by-step procedure to obtain the 5th percentile using the MINITAB software:
- Choose Graph > Probability Distribution Plot choose View Probability > OK.
- From Distribution, choose ‘Normal’ distribution.
- Click the Shaded Area tab.
- Choose Probability Value and Left Tail for the region of the curve to shade.
- Enter the Probability value as 0.5.
- Click OK.
Output using the MINITAB software is given below:
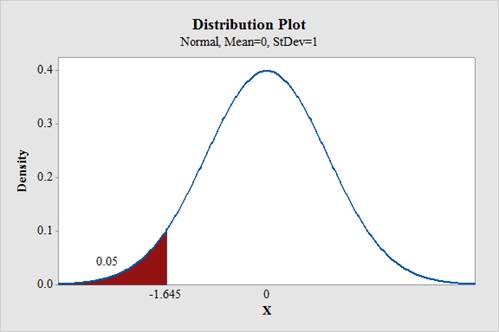
From the output, the z-score corresponding to the 5th percentile is –1.645.
The value of
Therefore, the rejection region is,
Power:
Software Procedure:
Step-by-step procedure to obtain the
- Choose Graph > Probability Distribution Plot choose View Probability > OK.
- From Distribution, choose ‘Normal’ distribution.
- Click the Shaded Area tab.
- Choose X Value and Left Tail for the region of the curve to shade.
- Enter the data value as -0.65.
- Click OK.
Output using the MINITAB software is given below:
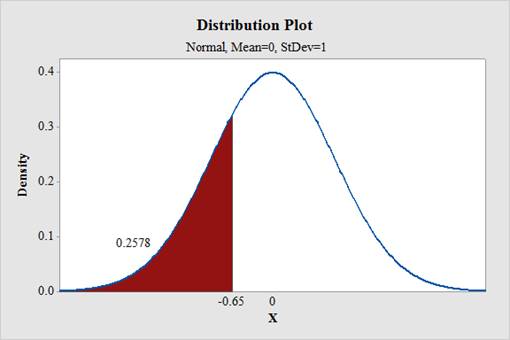
From the output,
Thus, the power is 0.2578.
d.
Find the level.
Answer to Problem 5E
The power is 0.4364.
Explanation of Solution
Calculation:
The rejection region is
80th percentile:
Software Procedure:
Step-by-step procedure to obtain the 80th percentile using the MINITAB software:
- Choose Graph > Probability Distribution Plot choose View Probability > OK.
- From Distribution, choose ‘Normal’ distribution.
- Click the Shaded Area tab.
- Choose Probability Value and Left Tail for the region of the curve to shade.
- Enter the Probability value as 0.80.
- Click OK.
Output using the MINITAB software is given below:
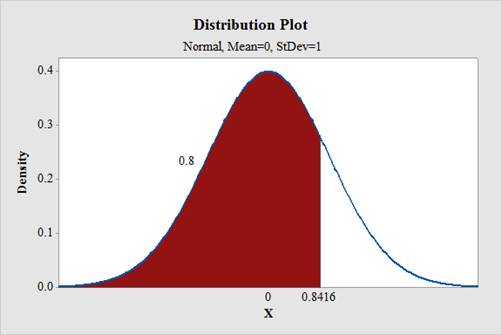
From the output, the z-score corresponding to the 80th percentile is 0.84.
The value of
Therefore, the rejection region is,
Power:
Software Procedure:
Step-by-step procedure to obtain the
- Choose Graph > Probability Distribution Plot choose View Probability > OK.
- From Distribution, choose ‘Normal’ distribution.
- Click the Shaded Area tab.
- Choose X Value and Left Tail for the region of the curve to shade.
- Enter the data value as -0.16.
- Click OK.
Output using the MINITAB software is given below:
From the output,
Thus, the power is 0.4364.
e.
Find the sample size if the test is made at the 5% level.
Answer to Problem 5E
About 618 tires should be sampled in total so that the power is 0.80 if the test is made at the 5% level.
Explanation of Solution
Calculation:
The 5% rejection region is
From part c., the z-score corresponding to the 5th percentile is –1.645.
The value of
For power 0.80, the rejection region is
From part d., the z-score corresponding to the 80th percentile is 0.84.
The value of
Therefore,
Thus, the required sample size is 618.
Want to see more full solutions like this?
Chapter 6 Solutions
Statistics for Engineers and Scientists
Additional Math Textbook Solutions
Business Analytics
Statistical Techniques in Business and Economics
PRACTICE OF STATISTICS F/AP EXAM
Developmental Mathematics (9th Edition)
Business Statistics: A First Course (7th Edition)
Introductory Statistics (10th Edition)


 MATLAB: An Introduction with ApplicationsStatisticsISBN:9781119256830Author:Amos GilatPublisher:John Wiley & Sons Inc
 Probability and Statistics for Engineering and th...StatisticsISBN:9781305251809Author:Jay L. DevorePublisher:Cengage Learning
 Statistics for The Behavioral Sciences (MindTap C...StatisticsISBN:9781305504912Author:Frederick J Gravetter, Larry B. WallnauPublisher:Cengage Learning
 Elementary Statistics: Picturing the World (7th E...StatisticsISBN:9780134683416Author:Ron Larson, Betsy FarberPublisher:PEARSON
 The Basic Practice of StatisticsStatisticsISBN:9781319042578Author:David S. Moore, William I. Notz, Michael A. FlignerPublisher:W. H. Freeman
 Introduction to the Practice of StatisticsStatisticsISBN:9781319013387Author:David S. Moore, George P. McCabe, Bruce A. CraigPublisher:W. H. Freeman