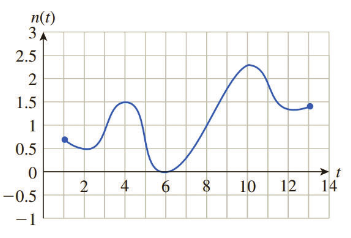
Online Auctions The following graph shows the rate of change n ( t ) of the number of active eBay users, in millions of users per quarter, from the first quarter of 2008 through the first quarter of 2011. ( t is time in quarters; t = 1 represents the first quarter of 2008.) 29 Use a left Riemann sum with four subdivisions to estimate the total change in the number of active users from the second quarter of 2008 to the second quarter of 2010 (the interval [ 2 , 10 ] ). [ HINT: See Example 3.]
Online Auctions The following graph shows the rate of change n ( t ) of the number of active eBay users, in millions of users per quarter, from the first quarter of 2008 through the first quarter of 2011. ( t is time in quarters; t = 1 represents the first quarter of 2008.) 29 Use a left Riemann sum with four subdivisions to estimate the total change in the number of active users from the second quarter of 2008 to the second quarter of 2010 (the interval [ 2 , 10 ] ). [ HINT: See Example 3.]
Solution Summary: The author explains how to calculate the total variation in active eBay users from the second quarter of 2008 to 2010 by using Riemann sum and take subdivisions.
Online Auctions The following graph shows the rate of change
n
(
t
)
of the number of active eBay users, in millions of users per quarter, from the first quarter of 2008 through the first quarter of 2011. (t is time in quarters;
t
=
1
represents the first quarter of 2008.)29
Use a left Riemann sum with four subdivisions to estimate the total change in the number of active users from the second quarter of 2008 to the second quarter of 2010 (the interval
[
2
,
10
]
Need a deep-dive on the concept behind this application? Look no further. Learn more about this topic, calculus and related others by exploring similar questions and additional content below.
Definite Integral Calculus Examples, Integration - Basic Introduction, Practice Problems; Author: The Organic Chemistry Tutor;https://www.youtube.com/watch?v=rCWOdfQ3cwQ;License: Standard YouTube License, CC-BY


 Algebra & Trigonometry with Analytic GeometryAlgebraISBN:9781133382119Author:SwokowskiPublisher:Cengage