Elementary Statistics: A Step By Step Approach
10th Edition
ISBN: 9781259755330
Author: Allan G. Bluman
Publisher: McGraw-Hill Education
bartleby

Concept explainers

bartleby

Videos

Textbook Question
Book Icon
Chapter 6.3, Problem 9E

New Residences The average number of moves a person makes in his or her lifetime is 12. If the standard deviation is 3.2, find the probability that the mean of a sample of 36 people is

a. Less than 10

b. Greater than 10

c. Between 11 and 12

a.

Expert Solution
Check Mark
To determine

To obtain: The probability that a random sample of 36 people is less than 10.

Answer to Problem 9E

The probability that a random sample of 36 people is less than 10 is 0.00009.

Explanation of Solution

Given info:

Average number of moves a person makes in his or her lifetime is μ=12 , standard deviation of number of moves a person makes in his or her lifetime is σ=3.2 and the sample size is n=36 .

Calculations:

The random variable x represents number of moves of a person in his/her lifetime.

The notation X¯ represents the mean number of moves of a person in his/her lifetime

The formula for finding the z score using central limit theorem is,

z=X¯μσn

Substitute 10 for X¯ , 12 for μ , 3.2 for σ and 36 for n

z=(1012)3.236=3.75

The probability that the mean of the selected sample will be less than 10 moves represents the area to the left of ­3.75.

Software procedure:

Step-by-step procedure to obtain the probability using the MINITAB software:

  • Choose Graph > Probability Distribution Plot choose View Probability> OK.
  • From Distribution, choose ‘Normal’ distribution.
  • Enter the Mean as 0.0 and Standard deviation as 1.0.
  • Click the Shaded Area tab.
  • Choose X value and Left Tail for the region of the curve to shade.
  • Enter the X value as –3.75.
  • Click OK.
  • Output using the MINITAB software is given below:
  • Elementary Statistics: A Step By Step Approach, Chapter 6.3, Problem 9E , additional homework tip  1

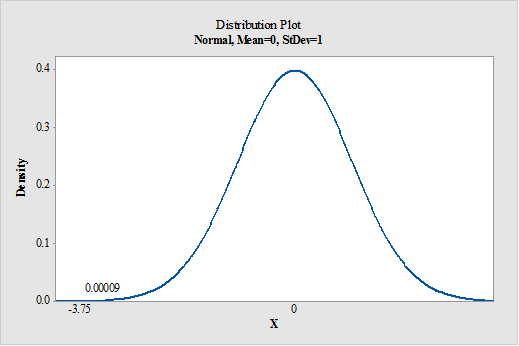
From MINITAB output, the probability that a random sample of 36 people is less than 10 is 0.00009.

  • b.
Expert Solution
Check Mark
To determine

To obtain: The probability that a random sample of 36 people is greater than 10.

Answer to Problem 9E

Probability will be 0.9999.

Explanation of Solution

Calculations:

The formula for finding the z score using central limit theorem is,

z=X¯μσn

Substitute 10 for X¯ , 12 for μ , 3.2 for σ and 36 for n

z=(1012)3.236=3.75

The probability that a random sample of 36 people greater than 10 represents the area to the right of –3.75.

Software procedure:

Step-by-step procedure to obtain the probability using the MINITAB software:

  • Choose Graph > Probability Distribution Plot choose View Probability> OK.
  • From Distribution, choose ‘Normal’ distribution.
  • Enter the Mean as 0.0 and Standard deviation as 1.0.
  • Click the Shaded Area tab.
  • Choose X value and Right Tail for the region of the curve to shade.
  • Enter the X value as –3.75.
  • Click OK.
  • Output using the MINITAB software is given below:
  • Elementary Statistics: A Step By Step Approach, Chapter 6.3, Problem 9E , additional homework tip  2
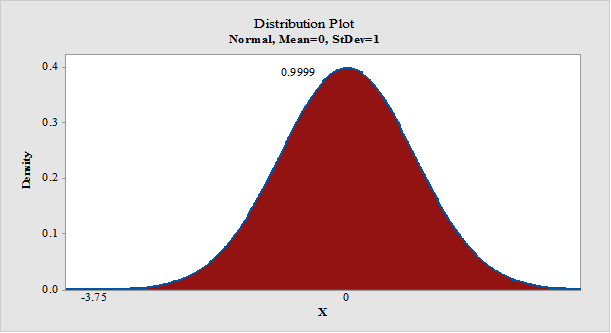
  • From MINITAB output, the probability that a random sample of 36 people greater than 10 is 0.9999.
  • c.
Expert Solution
Check Mark
To determine

The probability that a random sample of 36 people between 11 and 12.

Answer to Problem 9E

The probability that a random sample of 36 people is between 11 and 12 is 0.4699.

Explanation of Solution

Calculations:

The formula for finding the z score using central limit theorem is,

z=X¯μσn

Substitute 11 and 12 for X¯1 and X¯2 , 12 for μ , 3.2 for σ and 36 for n

z1=(1112)3.236=1.88z2=(1212)3.236=0

The probability that a random sample of 36 people is between 11 and 12 represents area between the value 1.88 and 0.

Software procedure:

Step-by-step procedure to obtain the probability using the MINITAB software:

  • Choose Graph > Probability Distribution Plot choose View Probability> OK.
  • From Distribution, choose ‘Normal’ distribution.
  • Enter the Mean as 0.0 and Standard deviation as 1.0.
  • Click the Shaded Area tab.
  • Choose X value and Middle for the region of the curve to shade.
  • Enter the X value 1 as –1.88 and X value 2 as 0.
  • Click OK.
  • Output using the MINITAB software is given below:

Elementary Statistics: A Step By Step Approach, Chapter 6.3, Problem 9E , additional homework tip  3

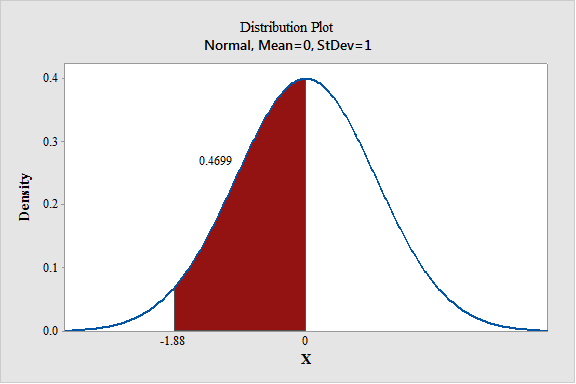
From MINITAB output, the probability that a random sample of 36 people is between 11 and 12 is 0.4699.

Want to see more full solutions like this?

Subscribe now to access step-by-step solutions to millions of textbook problems written by subject matter experts!

Chapter 6 Solutions

Elementary Statistics: A Step By Step Approach

Ch. 6.1 - For Exercises 7 through 26, find the area under...Ch. 6.1 - For Exercises 7 through 26, find the area under...Ch. 6.1 - For Exercises 7 through 26, find the area under...Ch. 6.1 - For Exercises 7 through 26, find the area under...Ch. 6.1 - For Exercises 7 through 26, find the area under...Ch. 6.1 - For Exercises 7 through 26, find the area under...Ch. 6.1 - For Exercises 7 through 26, find the area under...Ch. 6.1 - For Exercises 7 through 26, find the area under...Ch. 6.1 - For Exercises 7 through 26, find the area under...Ch. 6.1 - For Exercises 7 through 26, find the area under...Ch. 6.1 - For Exercises 7 through 26, find the area under...Ch. 6.1 - For Exercises 7 through 26, find the area under...Ch. 6.1 - For Exercises 7 through 26, find the area under...Ch. 6.1 - For Exercises 7 through 26, find the area under...Ch. 6.1 - For Exercises 7 through 26, find the area under...Ch. 6.1 - For Exercises 7 through 26, find the area under...Ch. 6.1 - For Exercises 7 through 26, find the area under...Ch. 6.1 - In Exercises 27 through 40, find the probabilities...Ch. 6.1 - In Exercises 27 through 40, find the probabilities...Ch. 6.1 - In Exercises 27 through 40, find the probabilities...Ch. 6.1 - In Exercises 27 through 40, find the probabilities...Ch. 6.1 - In Exercises 27 through 40, find the probabilities...Ch. 6.1 - In Exercises 27 through 40, find the probabilities...Ch. 6.1 - In Exercises 27 through 40, find the probabilities...Ch. 6.1 - In Exercises 27 through 40, find the probabilities...Ch. 6.1 - In Exercises 27 through 40, find the probabilities...Ch. 6.1 - In Exercises 27 through 40, find the probabilities...Ch. 6.1 - In Exercises 27 through 40, find the probabilities...Ch. 6.1 - In Exercises 27 through 40, find the probabilities...Ch. 6.1 - In Exercises 27 through 40, find the probabilities...Ch. 6.1 - In Exercises 27 through 40, find the probabilities...Ch. 6.1 - For Exercises 41 through 46, find the z value that...Ch. 6.1 - For Exercises 41 through 46, find the z value that...Ch. 6.1 - For Exercises 41 through 46, find the z value that...Ch. 6.1 - For Exercises 41 through 46, find the z value that...Ch. 6.1 - For Exercises 41 through 46, find the z value that...Ch. 6.1 - For Exercises 41 through 46, find the z value that...Ch. 6.1 - Find the z value to the left of the mean so that...Ch. 6.1 - Find the z value to the right of the mean so that...Ch. 6.1 - Find two z values, one positive and one negative,...Ch. 6.1 - Find two z values so that 48% of the middle area...Ch. 6.1 - Prob. 51ECCh. 6.1 - Prob. 52ECCh. 6.1 - Prob. 53ECCh. 6.1 - For Exercises 5356, z0 is the statistical notation...Ch. 6.1 - Prob. 55ECCh. 6.1 - Prob. 56ECCh. 6.1 - Prob. 57ECCh. 6.1 - Prob. 58ECCh. 6.1 - Prob. 59ECCh. 6.1 - Find P(z 2.3 and z 1.2).Ch. 6.2 - Applying the Concepts 62 Smart People Assume you...Ch. 6.2 - Automobile Workers A worker in the automobile...Ch. 6.2 - Teachers Salaries The average annual salary for...Ch. 6.2 - Population in U.S. Jails The average daily jail...Ch. 6.2 - SAT Scores The national average SAT score (for...Ch. 6.2 - Chocolate Bar Calories The average number of...Ch. 6.2 - Monthly Mortgage Payments The average monthly...Ch. 6.2 - Prison Sentences The average prison sentence for a...Ch. 6.2 - Doctoral Student Salaries Full-time Ph.D. students...Ch. 6.2 - Miles Driven Annually The mean number of miles...Ch. 6.2 - Commute Time to Work The average commute to work...Ch. 6.2 - Credit Card Debt The average credit card debt for...Ch. 6.2 - Price of Gasoline The average retail price of...Ch. 6.2 - Potholes The average number of potholes per 10...Ch. 6.2 - Newborn Elephant Weights Newborn elephant calves...Ch. 6.2 - Heart Rates For a certain group of individuals,...Ch. 6.2 - Salary of Full Professors The average salary of a...Ch. 6.2 - Cat Behavior A report stated that the average...Ch. 6.2 - Itemized Charitable Contributions The average...Ch. 6.2 - New Home Sizes A contractor decided to build homes...Ch. 6.2 - New-Home Prices If the average price of a new...Ch. 6.2 - Cost of Personal Computers The average price of a...Ch. 6.2 - Reading Improvement Program To help students...Ch. 6.2 - Qualifying Test Scores To qualify for a medical...Ch. 6.2 - Ages of Amtrak Passenger Cars The average age of...Ch. 6.2 - Lengths of Hospital Stays The average length of a...Ch. 6.2 - High School Competency Test A mandatory competency...Ch. 6.2 - Product Marketing An advertising company plans to...Ch. 6.2 - Bottled Drinking Water Americans drank an average...Ch. 6.2 - Wristwatch Lifetimes The mean lifetime of a...Ch. 6.2 - Police Academy Acceptance Exams To qualify for a...Ch. 6.2 - In the distributions shown, state the mean and...Ch. 6.2 - SAT Scores Suppose that the mathematics SAT scores...Ch. 6.2 - Temperatures for Pittsburgh The mean temperature...Ch. 6.2 - Standardizing If a distribution of raw scores were...Ch. 6.2 - Social Security Payments Consider the distribution...Ch. 6.2 - Find the Mean In a normal distribution, find when...Ch. 6.2 - Internet Users U.S. internet users spend an...Ch. 6.2 - Exam Scores An instructor gives a 100-point...Ch. 6.2 - Drive-in Movies The data shown represent the...Ch. 6.2 - Prob. 40ECh. 6.2 - Prob. 41ECh. 6.2 - Prob. 42ECh. 6.2 - Prob. 43ECh. 6.3 - Applying the Concepts 63 Times To Travel to School...Ch. 6.3 - Prob. 1ECh. 6.3 - Why do most of the sample means differ somewhat...Ch. 6.3 - What is the mean of the sample means?Ch. 6.3 - What is the standard deviation of the sample means...Ch. 6.3 - What does the central limit theorem say about the...Ch. 6.3 - What formula is used to gain information about an...Ch. 6.3 - Life of Smoke Detectors The average lifetime of...Ch. 6.3 - Glass Garbage Generation A survey found that the...Ch. 6.3 - New Residences The average number of moves a...Ch. 6.3 - Teachers Salaries in Connecticut The average...Ch. 6.3 - Earthquakes The average number of earthquakes that...Ch. 6.3 - Teachers Salaries in North Dakota The average...Ch. 6.3 - Movie Ticket Prices In the second quarter of 2015,...Ch. 6.3 - SAT Scores The national average SAT score (for...Ch. 6.3 - Cost of Overseas Trip The average overseas trip...Ch. 6.3 - Cell Phone Lifetimes A recent study of the...Ch. 6.3 - Water Use The Old Farmers Almanac reports that the...Ch. 6.3 - Medicare Hospital Insurance The average yearly...Ch. 6.3 - Amount of Laundry Washed Each Year Procter Gamble...Ch. 6.3 - Per Capita Income of Delaware Residents In a...Ch. 6.3 - Monthly Precipitation for Miami The mean...Ch. 6.3 - Systolic Blood Pressure Assume that the mean...Ch. 6.3 - Cholesterol Content The average cholesterol...Ch. 6.3 - Ages of Proofreaders At a large publishing...Ch. 6.3 - TIMSS Test On the Trends in International...Ch. 6.3 - Life Expectancies In a study of the life...Ch. 6.3 - Home Values A study of 800 homeowners in a certain...Ch. 6.3 - Breaking Strength of Steel Cable The average...Ch. 6.3 - Prob. 29ECCh. 6.3 - Prob. 30ECCh. 6.4 - Applying the Concepts 64 Mountain Climbing Safety...Ch. 6.4 - Explain why a normal distribution can be used as...Ch. 6.4 - What conditions must be met to use the normal...Ch. 6.4 - Why is a correction for continuity necessary?Ch. 6.4 - When is the normal distribution not a good...Ch. 6.4 - Check each binomial distribution to see whether it...Ch. 6.4 - Check each binomial distribution to see whether it...Ch. 6.4 - Single Americans In a recent year, about 22% of...Ch. 6.4 - School Enrollment Of all 3- to 5-year-old...Ch. 6.4 - Home Ownership In a recent year, the rate of U.S....Ch. 6.4 - Mail Order A mail order company has an 8% success...Ch. 6.4 - Small Business Owners Seventy-six percent of small...Ch. 6.4 - Selected Technologies According to the World...Ch. 6.4 - Back Injuries Twenty-two percent of work injuries...Ch. 6.4 - Population of College Cities College students...Ch. 6.4 - Mistakes in Restaurant Bills About 12.5% of...Ch. 6.4 - Internet Browsers The top web browser in 2015 was...Ch. 6.4 - Female Americans Who Have Completed 4 Years of...Ch. 6.4 - Prob. 20ECh. 6.4 - Elementary School Teachers Women comprise 80.3% of...Ch. 6.4 - Prob. 22ECh. 6.4 - Prob. 23ECCh. 6 - Find the area under the standard normal...Ch. 6 - Find the area under the standard normal...Ch. 6 - Using the standard normal distribution, find each...Ch. 6 - Using the standard normal distribution, find each...Ch. 6 - Per Capita Spending on Health Care The average per...Ch. 6 - Salaries for Actuaries The average salary for...Ch. 6 - Commuter Train Passengers On a certain run of a...Ch. 6 - Monthly Spending for Paging and Messaging Services...Ch. 6 - Cost of Smartphone Repair The average cost of...Ch. 6 - Slot Machine Earnings The average amount a slot...Ch. 6 - Private Four-Year College Enrollment A random...Ch. 6 - Heights of Active Volcanoes The heights (in feet...Ch. 6 - Confectionary Products Americans ate an average of...Ch. 6 - Average Precipitation For the first 7 months of...Ch. 6 - Sodium in Frozen Food The average number of...Ch. 6 - Wireless Sound System Lifetimes A recent study of...Ch. 6 - Retirement Income Of the total population of...Ch. 6 - Slot Machines The probability of winning on a slot...Ch. 6 - Multiple-Job Holders According to the government,...Ch. 6 - Enrollment in Personal Finance Course In a large...Ch. 6 - U.S. Population Of the total U.S. population, 37%...Ch. 6 - Larceny-Thefts Excluding motor vehicle thefts, 26%...Ch. 6 - Determine whether each statement is true or false....Ch. 6 - Prob. 2CQCh. 6 - Determine whether each statement is true or false....Ch. 6 - The z value corresponding to a number below the...Ch. 6 - Determine whether each statement is true or false....Ch. 6 - Prob. 6CQCh. 6 - Select the best answer. 7. The mean of the...Ch. 6 - Approximately what percentage of normally...Ch. 6 - Which is not a property of the standard normal...Ch. 6 - When a distribution is positively skewed, the...Ch. 6 - Prob. 11CQCh. 6 - Complete the following statements with the best...Ch. 6 - The difference between a sample mean and a...Ch. 6 - The mean of the sample means equals ________.Ch. 6 - The standard deviation of all possible sample...Ch. 6 - The normal distribution can be used to approximate...Ch. 6 - Prob. 17CQCh. 6 - Find the area under the standard normal...Ch. 6 - Using the standard normal distribution, find each...Ch. 6 - Amount of Rain in a City The average amount of...Ch. 6 - Heights of People The average height of a certain...Ch. 6 - Sports Drink Consumption The average number of...Ch. 6 - Years to Complete a Graduate Program The average...Ch. 6 - Passengers on a Bus On the daily run of an express...Ch. 6 - Thickness of Library Books The average thickness...Ch. 6 - Prob. 26CQCh. 6 - Prob. 27CQCh. 6 - Electric Bills The average electric bill in a...Ch. 6 - Sleep Survey According to a recent survey, 38% of...Ch. 6 - Prob. 30CQCh. 6 - Household Online Connection The percentage of U.S....Ch. 6 - Prob. 32CQCh. 6 - Prob. 33CQCh. 6 - GMAT Scores The average GMAT scores for the top-30...Ch. 6 - Prob. 1CTCCh. 6 - Sometimes a researcher must decide whether a...Ch. 6 - Prob. 3CTCCh. 6 - Prob. 4CTCCh. 6 - Sometimes a researcher must decide whether a...Ch. 6 - Prob. 6CTCCh. 6 - Formulas Confirm the two formulas hold true for...
Knowledge Booster
Background pattern image
Statistics
Learn more about
Need a deep-dive on the concept behind this application? Look no further. Learn more about this topic, statistics and related others by exploring similar questions and additional content below.
Recommended textbooks for you
Text book image
Glencoe Algebra 1, Student Edition, 9780079039897...
Algebra
ISBN:9780079039897
Author:Carter
Publisher:McGraw Hill
Bayes' Theorem 1: Introduction and conditional probability; Author: Dr Nic's Maths and Stats;https://www.youtube.com/watch?v=lQVkXfJ-rpU;License: Standard YouTube License, CC-BY
What is Conditional Probability | Bayes Theorem | Conditional Probability Examples & Problems; Author: ACADGILD;https://www.youtube.com/watch?v=MxOny_1y2Q4;License: Standard YouTube License, CC-BY
Bayes' Theorem of Probability With Tree Diagrams & Venn Diagrams; Author: The Organic Chemistry Tutor;https://www.youtube.com/watch?v=OByl4RJxnKA;License: Standard YouTube License, CC-BY
Bayes' Theorem - The Simplest Case; Author: Dr. Trefor Bazett;https://www.youtube.com/watch?v=XQoLVl31ZfQ;License: Standard Youtube License