Figure 6.22 Airline Hub Location Model A D E G H K L M Q 1 Western Airlines hub location model 3 Input data: which cities are covered by which potential hubs Potential hub Range names used Hubs covered by -Model$B$25:$B$36 =ModellSB$39 EModel!$B$21:$M$21 4 5 City AT CH DE LA NO NY PI SL SF SE Total hubs Used as_hub 6 JAT 7 leo 1 1 8 CH 9 DE 1 1 1 10 HO 1 1 11 |LA 1 12 NO 1 13 NY 1 1 14 PI 1 1 15 SL 16 ISF 17 ISE 1 1 18 19 Decisions: which cities to use as hubs 20 AT BO CH DE но LA NO NY PI SL SF SE 21 Used as hub 1. 1 1 0 22 23 Constraints that each city must be covered by at least one hub 24 City Hubs covered by Required 25 JAT 1 26 B0 27 CH 1. 1. 1 28 DE 1 1 29 HO 1 30 ILA 1 1 31 NO 1 32 NY 1 33 PI 1 1 34 SL 35 ISF 1. 36 SE >= 37 38 Objective to minimize 39 Total hubs
Figure 6.22 Airline Hub Location Model A D E G H K L M Q 1 Western Airlines hub location model 3 Input data: which cities are covered by which potential hubs Potential hub Range names used Hubs covered by -Model$B$25:$B$36 =ModellSB$39 EModel!$B$21:$M$21 4 5 City AT CH DE LA NO NY PI SL SF SE Total hubs Used as_hub 6 JAT 7 leo 1 1 8 CH 9 DE 1 1 1 10 HO 1 1 11 |LA 1 12 NO 1 13 NY 1 1 14 PI 1 1 15 SL 16 ISF 17 ISE 1 1 18 19 Decisions: which cities to use as hubs 20 AT BO CH DE но LA NO NY PI SL SF SE 21 Used as hub 1. 1 1 0 22 23 Constraints that each city must be covered by at least one hub 24 City Hubs covered by Required 25 JAT 1 26 B0 27 CH 1. 1. 1 28 DE 1 1 29 HO 1 30 ILA 1 1 31 NO 1 32 NY 1 33 PI 1 1 34 SL 35 ISF 1. 36 SE >= 37 38 Objective to minimize 39 Total hubs

Practical Management Science
6th Edition
ISBN:9781337406659
Author:WINSTON, Wayne L.
Publisher:WINSTON, Wayne L.
Chapter5: Network Models
Section5.3: Assignment Models
Problem 12P

Related questions

Question
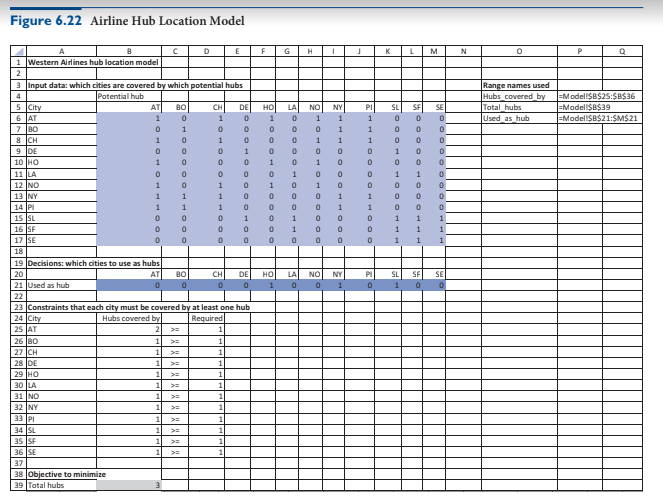
In the original Western set-covering model in Figure 6.22, we assumed that each city must be covered by at least one hub. Suppose that for added flexibility in flight routing, Western requires that each city must be covered by at least two hubs. How do the model and optimal solution change?
Transcribed Image Text:Figure 6.22 Airline Hub Location Model
A
D
E
G
H
K
L
M
Q
1 Western Airlines hub location model
3 Input data: which cities are covered by which potential hubs
Potential hub
Range names used
Hubs covered by
-Model$B$25:$B$36
=ModellSB$39
EModel!$B$21:$M$21
4
5 City
AT
CH
DE
LA
NO
NY
PI
SL
SF
SE
Total hubs
Used as_hub
6 JAT
7 leo
1
1
8 CH
9 DE
1
1
1
10 HO
1
1
11 |LA
1
12 NO
1
13 NY
1
1
14 PI
1
1
15 SL
16 ISF
17 ISE
1
1
18
19 Decisions: which cities to use as hubs
20
AT
BO
CH
DE
но
LA
NO
NY
PI
SL
SF
SE
21 Used as hub
1.
1
1 0
22
23 Constraints that each city must be covered by at least one hub
24 City
Hubs covered by
Required
25 JAT
1
26 B0
27 CH
1.
1.
1
28 DE
1
1
29 HO
1
30 ILA
1
1
31 NO
1
32 NY
1
33 PI
1
1
34 SL
35 ISF
1.
36 SE
>=
37
38 Objective to minimize
39 Total hubs
Expert Solution
This question has been solved!
Explore an expertly crafted, step-by-step solution for a thorough understanding of key concepts.

This is a popular solution!

Trending now
This is a popular solution!

Step by step
Solved in 2 steps with 6 images

Knowledge Booster


Learn more about
Need a deep-dive on the concept behind this application? Look no further. Learn more about this topic, operations-management and related others by exploring similar questions and additional content below.Recommended textbooks for you
Practical Management Science
Operations Management
ISBN:
9781337406659
Author:
WINSTON, Wayne L.
Publisher:
Cengage,
Practical Management Science
Operations Management
ISBN:
9781337406659
Author:
WINSTON, Wayne L.
Publisher:
Cengage,