
Concept explainers
Videos
Suppose that we define the following events:
C =
A = event that a randomly selected driver is observed driving a passenger automobile
V = event that a randomly selected driver is observed driving a van or SUV
T = event that a randomly selected driver is observed driving a pickup truck
The probabilities given below are based on data from the National Highway Traffic Safety Administration (“Traffic Safety Facts,” February 2014):
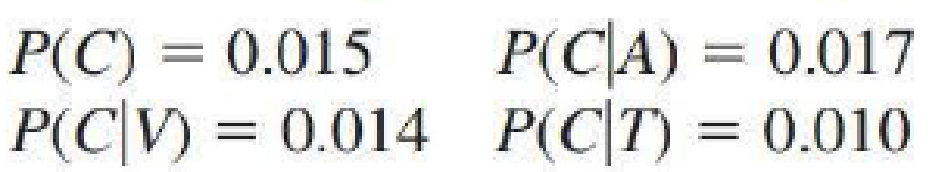
Explain why P(C) is not just the average of the three given conditional probabilities.
6.81 The accompanying table summarizes data from a medical expenditures survey carried out by the National Center for Health Statistics (“Assessing the Effects of Race and Ethnicity on Use of Complementary and Alternative Therapies in the USA,” Ethnicity and Health [2005]: 19-32).
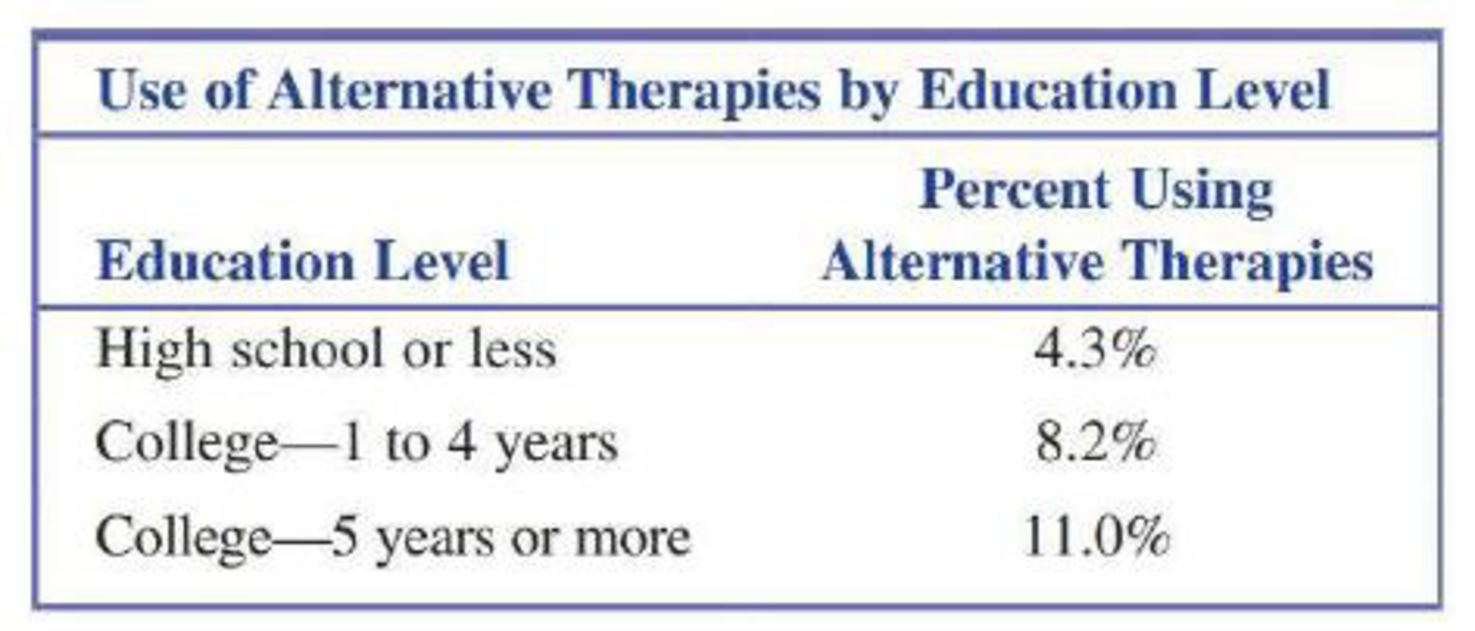
These percentages were based on data from 7320 people whose education level was high school or less, 4793 people with I to 4 years of college, and 1095 people with 5 or more years of college.
- a. Use the information given to determine the number of respondents falling into each of the six cells of the table below.
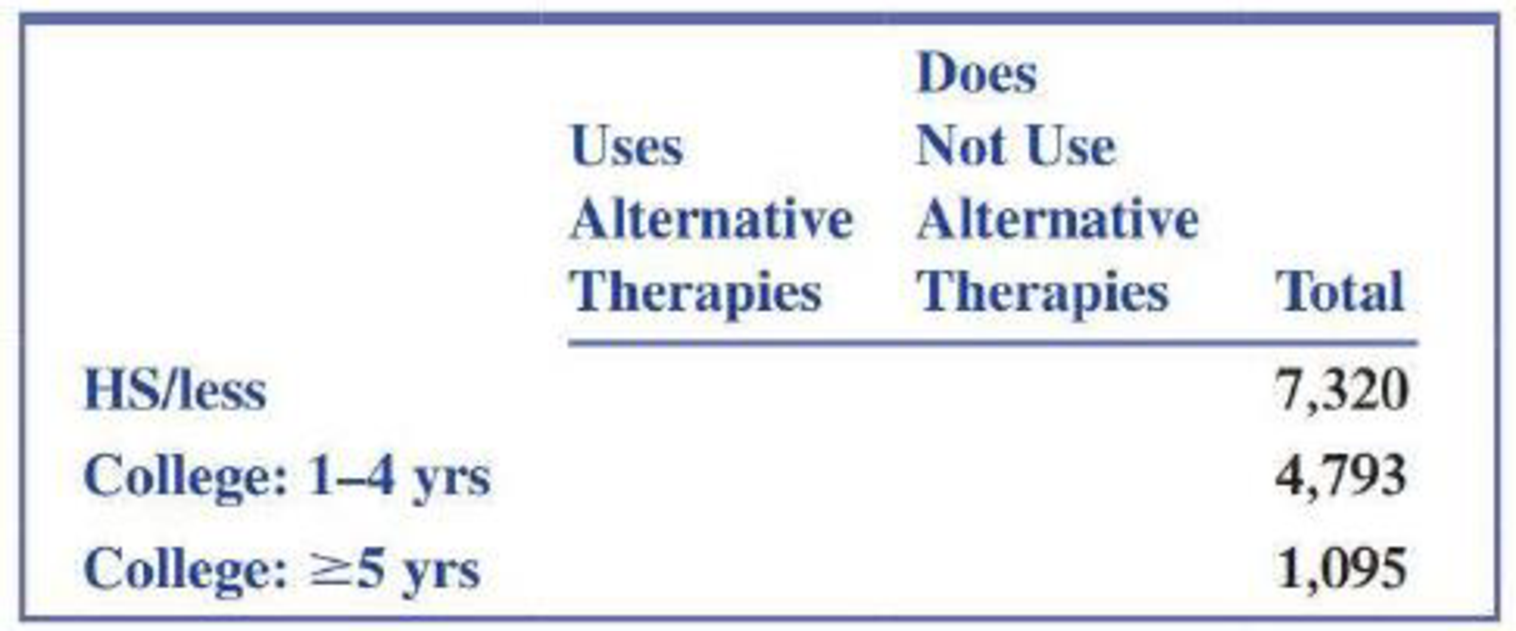
- b. Construct a table of estimated probabilities by dividing the count in each of the six table cells by the total sample size, n = 13,208.
- c. The authors of the study indicated that the sample was selected in a way that makes it reasonable to regard the estimated probabilities in the table from Part (b) as representative of the adult population in the United States. Use the information in that table to estimate the following probabilities for adults in the United States.
- i. The
probability that a randomly selected individual has 5 or more years of college. - ii. The probability that a randomly selected individual uses alternative therapies.
- i. The
Want to see the full answer?
Check out a sample textbook solution
Chapter 6 Solutions
Introduction To Statistics And Data Analysis


