
Concept explainers
Videos
The article “U.S. Investors Split Between Digital and Traditional Banking” (gallup.com, August 5, 2016, retrieved April 25, 2017) summarized data from a Gallup survey of a random sample of 1019 U.S. adults with investments of $10,000 or more. Based on the survey data, it was estimated that 31 % of investors manage their investments by doing everything they possibly can online. But the authors of the article also noted that there was quite a difference between younger investors (age 18 to 49) and older investors (age 50 and older). For younger investors, 43% said they do everything they possibly can online, while the percentage for older investors was 23%.
- a. Use the given information to estimate P(O), P(O|Y), and P(O|F) where O =
event that a randomly selected investor does everything possible online, Y = event that a randomly selected investor is age 18 to 49, and F = event that a ran do ml y selected investor is 50 years old or older. - b. Suppose that 40% of investors are between the ages of 18 and 49. Use the probabilities from Part (a) and the estimate P(Y) = 0.40 to calculate P(Y|O) and write a sentence interpreting this value.
6.81 The accompanying table summarizes data from a medical expenditures survey carried out by the National Center for Health Statistics (“Assessing the Effects of Race and Ethnicity on Use of Complementary and Alternative Therapies in the USA,” Ethnicity and Health [2005]: 19-32).
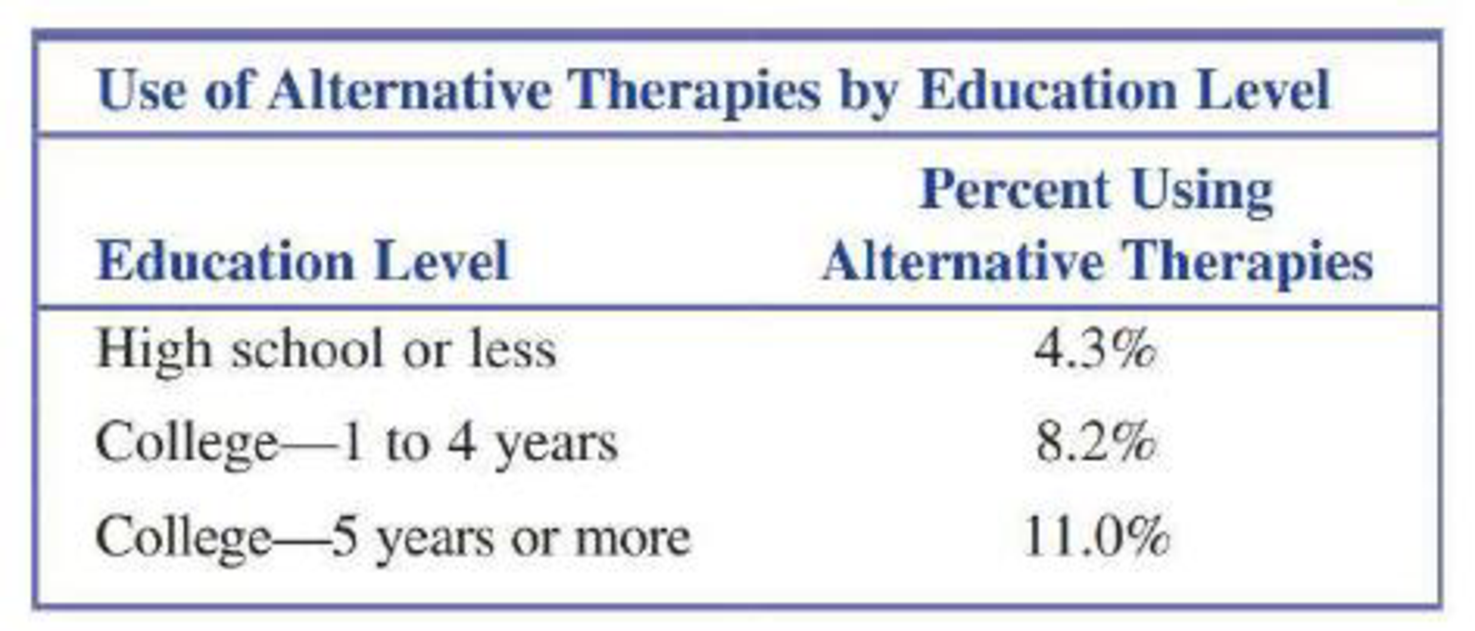
These percentages were based on data from 7320 people whose education level was high school or less, 4793 people with I to 4 years of college, and 1095 people with 5 or more years of college.
- a. Use the information given to determine the number of respondents falling into each of the six cells of the table below.
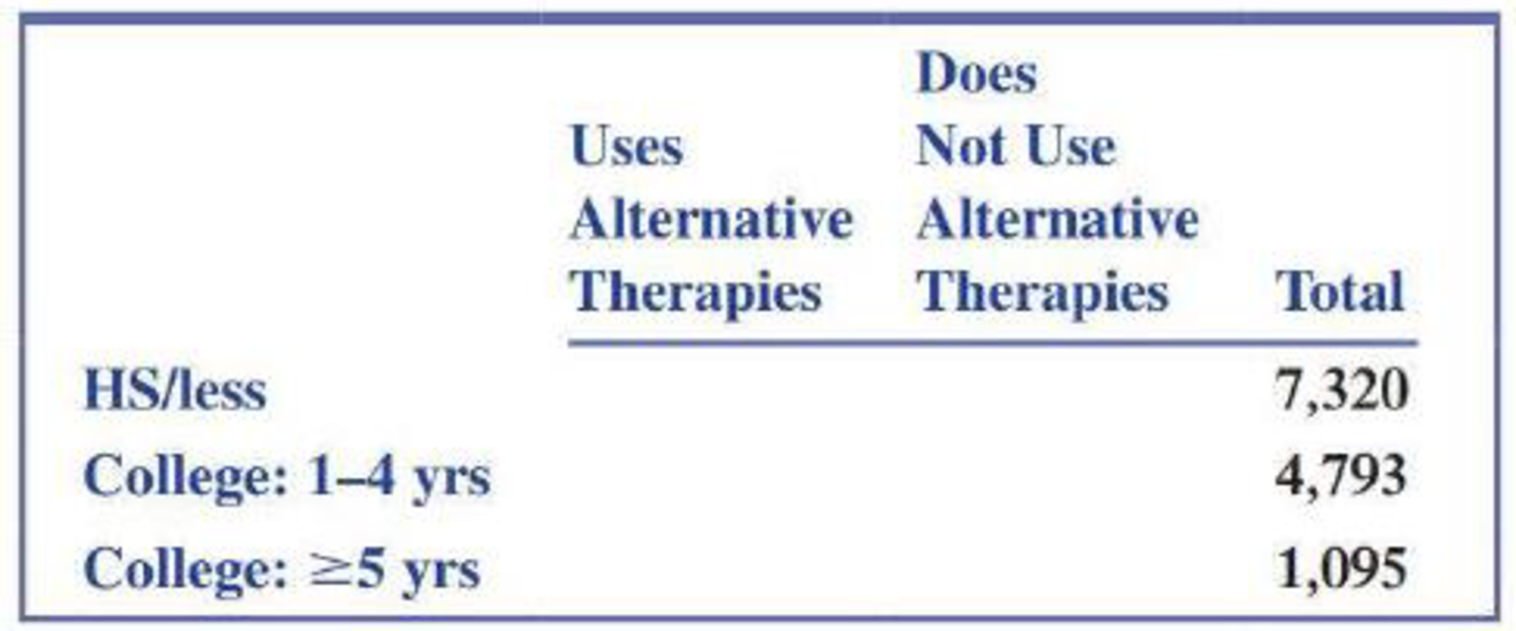
- b. Construct a table of estimated probabilities by dividing the count in each of the six table cells by the total sample size, n = 13,208.
- c. The authors of the study indicated that the sample was selected in a way that makes it reasonable to regard the estimated probabilities in the table from Part (b) as representative of the adult population in the United States. Use the information in that table to estimate the following probabilities for adults in the United States.
- i. The
probability that a randomly selected individual has 5 or more years of college. - ii. The probability that a randomly selected individual uses alternative therapies.
- i. The
Want to see the full answer?
Check out a sample textbook solution
Chapter 6 Solutions
Introduction To Statistics And Data Analysis


- What is an experiment?arrow_forwardIn an article in Accounting and Business Research, Beattie and Jones investigate the use and abuse of graphic presentations in the annual reports of United Kingdom firms. The authors found that 65 percent of the sampled companies graph at least one key financial variable, but that 30 percent of the graphics are materially distorted (nonzero vertical axis, exaggerated trend, or the like). Results for U.S. firms have been found to be similar. (a) Suppose that in a random sample of 451 graphics from the annual reports of United Kingdom firms, 146 of the graphics are found to be distorted. Find a point estimate of and a 95 percent confidence interval for the proportion of all U.K. annual report graphics that are distorted. (Round your answers to 4 decimal places.) (b) Based on this interval, can we be 95 percent confident that more than 25 percent of all graphics appearing in the annual reports of U.K. firms are distorted? Does this suggest that auditors should understand proper…arrow_forwardIt appears that there is some truth to the old adage “That which doesn’t kill us makes us stronger.” Seery, Holman, and Silver (2010) found that individuals with some history of adversity report better mental health and higher well-being compared to people with little or no history of adversity. In an attempt to examine this phenomenon, a researcher surveys a group of college students to determine the negative life events that they experienced in the past 5 years and their current feeling of well-being. For n = 18 participants with 2 or fewer negative experiences, the average well-being score is M = 42 with SS = 398, and for n = 16 participants with 5 to 10 negative experiences the average score is M = 48.6 with SS = 370. a.) Is there a significant difference between the two populations represented by these two samples? Include whether you reject or retain the Null Hypothesis. Use a two-tailed test with α = 0.01 b.) Compute Cohen’s d to measure the size of the effect. c.) Write a…arrow_forward
 Holt Mcdougal Larson Pre-algebra: Student Edition...AlgebraISBN:9780547587776Author:HOLT MCDOUGALPublisher:HOLT MCDOUGAL
 Glencoe Algebra 1, Student Edition, 9780079039897...AlgebraISBN:9780079039897Author:CarterPublisher:McGraw Hill