
Videos
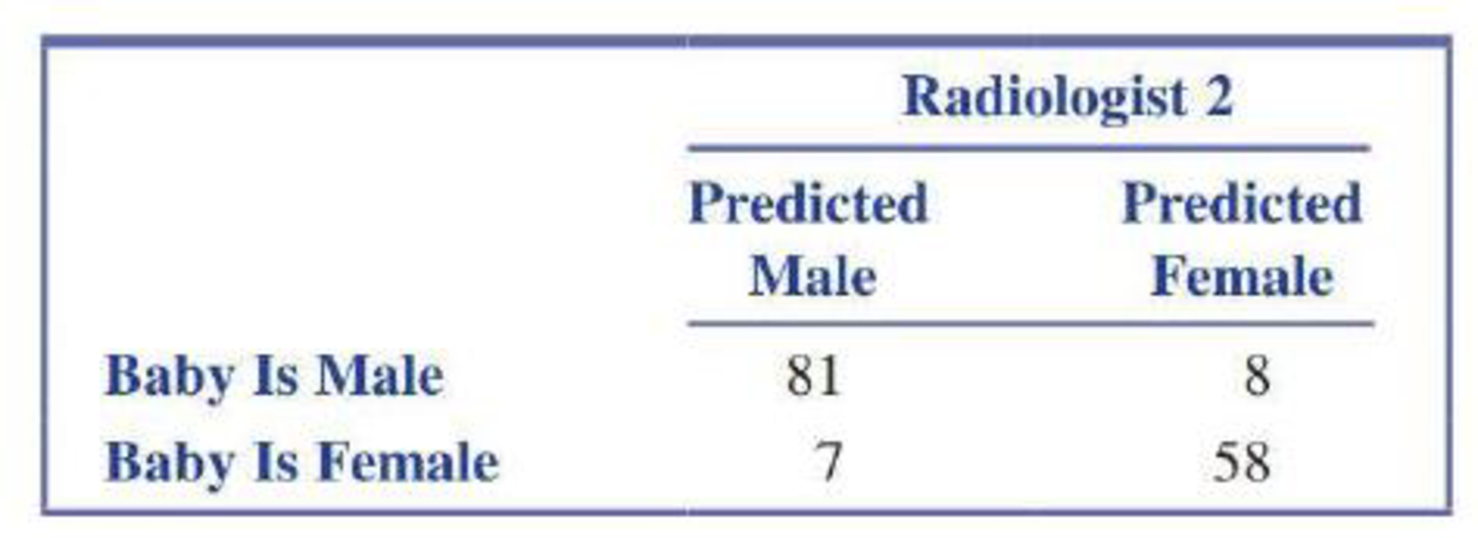
The paper referenced in the previous exercise also included data for a second radiologist, Radiologist 2. Based on the data from the previous exercise for Radiologist 1 and the data in the accompanying table for Radiologist 2, write a paragraph comparing the accuracy of sex predictions made by these two radiologists.
6.85 Radiologists are often asked to predict the sex of a baby from ultrasound images made during pregnancy. The authors of the paper “The Use of Three Dimensional Ultrasound for Fetal Gender Determination in the First Trimester” (The British Journal of Radiology, [2003]: 448-451) followed up on 159 predictions made by a particular radiologist (Radiologist 1) to determine whether or not they were correct. Data from the paper is summarized in the accompanying table.
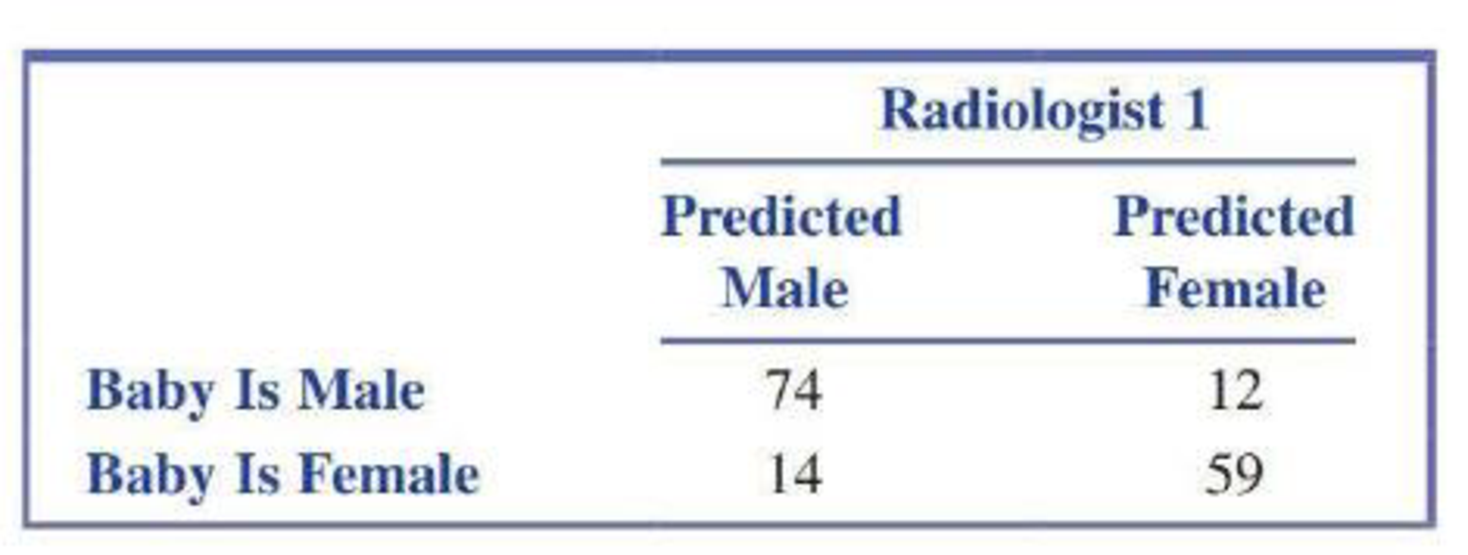
- a. Assuming that these data are representative of sex predictions made by Radiologist 1, estimate the
probability that a sex prediction is correct, given that the baby is male. - b. Assuming that these data are representative of sex predictions made by Radiologist 1, estimate the probability that a sex prediction is correct, given that the baby is female.
- c. For Radiologist 1, is a sex prediction more likely to be correct if the baby is male? Explain.
- d. Estimate the probability that a sex prediction made by Radiologist 1 is correct.
Want to see the full answer?
Check out a sample textbook solution
Chapter 6 Solutions
Introduction To Statistics And Data Analysis


- andres asked if there is a relationship between the quality of sneakers worn by a sample of 20 volleyball players and their average number of point scored per game. he computed r= +.21 and immediately claimed he had evidence that better-quality sneakers are related to better performance (a) is his claim correct? why? (b) what are Ho and Ha? (c) with alpha=.05, what is rcrit ?arrow_forwardIf the value of Cronbach’s alpha is 0.07, it means ___________; a. Research instrument is not reliable b. Research instrument is internally consistent c. Data is reliable d. Data is internally consistentarrow_forwardNike wants to launch a new type of sneakers for football players. It gives its new and old sneakers to Football Club Barcelona and asks 11 football players to how comfortable the sneakers are from 0 to 10 (10 means very comfortable). The data is in Sheet 29. Can Nike conclude that the new sneakers are more comfortable at alpha=0.05? Sheet 29 New Old 9 8 8 9 10 9 7 7 10 9 10 10 9 10 9 9 8 8 9 8 10 8 10 7 9 7 8 7 9 9 10 9 10 10 Select one: a. No, since p-value=0.034 which is less than alpha b. No, since t(stat)=2.52 is greater than t(cr.)=1.75 c. Yes, since t(stat)=2.52 is greater than t(cr.)=1.75 d. Yes, since…arrow_forward
- Researchers interested in lead exposure due to car exhaust sampled the blood of 52 police officers subjected to constant inhalation of automobile exhaust fumes while working traffic enforcement in a primarily urban environment. The blood samples of these officers had an average lead concentration of 124.32 µg/l and an SD of 37.74 µg/l; a previous study of individuals from a nearby suburb, with no history of exposure, found an average blood level concentration of 35 µg/l. Write down the hypotheses that would be appropriate for testing if the police officers appear to have been exposed to a higher concentration of lead. Explicitly state and check all conditions necessary for inference on these data. Test the hypothesis that the downtown police officers have a higher lead exposure than the group in the previous study. Interpret your results in context. Based on your preceding result, without performing a calculation, would a 99% confidence interval for the average blood concentration…arrow_forwardThe article “Effect of Varying Solids Concentration and Organic Loading on the Performance of Temperature Phased Anaerobic Digestion Process” (S. Vandenburgh and T. Ellis, Water Environment Research, 2002:142–148) discusses experiments to determine the effect of the solids concentration on the performance of treatment methods for wastewater sludge. In the first experiment, the concentration of solids (in g/L) was 43.94 ± 1.18. In the second experiment, which was independent of the first, the concentration was 48.66 ± 1.76. Estimate the difference in the concentration between the two experiments, and find the uncertainty in the estimate.arrow_forwardCell Phone Radiation Listed below are the measured radiation absorption rates (in W/kg) corresponding to these cell phones: iPhone 5S, BlackBerry Z30, Sanyo Vero, Optimus V, Droid Razr, Nokia N97, Samsung Vibrant, Sony Z750a, Kyocera Kona, LG G2, and Virgin Mobile Supreme. The data are from the Federal Communications Commission. If one of each model of cell phone is measured for radiation and the results are used to find the measures of variation, are the results typical of the population of cell phones that are in use?arrow_forward
- Can you please explain how to solve part i, using both the empirical rule and using a Z table?arrow_forwardConsider the following: In general, when people diet they typically lose 10 lbs. (?σ = 2). A random sample of 16 people on the keto diet lost 15 lbs. Do people on the keto diet lose more or less weight than people on diets in general? -Weight loss in the keto diet sample does differ from weight loss in the population of dieters in general (H1: X-bar does not equal Mu) -On average, weight loss in the keto diet sample does not differ from weight loss in the population of dieters in general. (H0: X-bar = Mu)) Question: 1. What is μxbar? 2.What is σxbar?arrow_forwardConsider the following: In general, when people diet they typically lose 10 lbs. (?σ = 2). A random sample of 16 people on the keto diet lost 15 lbs. Do people on the keto diet lose more or less weight than people on diets in general? -Weight loss in the keto diet sample does differ from weight loss in the population of dieters in general (H1: X-bar does not equal Mu) -On average, weight loss in the keto diet sample does not differ from weight loss in the population of dieters in general. (H0: X-bar = Mu)) Question: 1. What is ?????? 2.What is ??????arrow_forward
- The following table shows the length, in centimeters, of the humerus and the total wingspan, in centimeters, of several pterosaurs, which are extinct flying reptiles. (A graphing calculator is recommended.) (a) Find the equation of the least-squares regression line for the data. (Where × is the independent variable.) Round constants to the nearest hundredth. y= ? (b) Use the equation from part (a) to determine, to the nearest centimeter, the projected wingspan of a pterosaur if its humerus is 52 centimeters. ? cmarrow_forwardThe owner of a moving company typically has his most experienced manager predict the total number of labor hours that will be required to complete an upcoming move. This approach has proved useful in the past, but the owner has the business objective of developing a more accurate method of predicting labor hours. In a preliminary effort to provide a more accurate method, the owner has decided to use the number of cubic feet moved as the independent variable and has collected data for 36 moves in which the origin and destination were within the borough of Manhattan in New York City and in which the travel time was an insignificant portion of the hours worked. If the sum of squares Y is 1,513.32 and the sum of squares error is 176.22. What proportion of variation in labor hours is explained by the number of cubic feet moved? Hint: Provide answer accurate to 4 decimal places.arrow_forwardThe owner of a moving company typically has his most experienced manager predict the total number of labor hours that will be required to complete an upcoming move. This approach has proved useful in the past, but the owner has the business objective of developing a more accurate method of predicting labor hours. In a preliminary effort to provide a more accurate method, the owner has decided to use the number of cubic feet moved as the independent variable and has collected data for 36 moves in which the origin and destination were within the borough of Manhattan in New York City and in which the travel time was an insignificant portionof the hours worked. The intercept for the sample regression line that the owner has computed is -2.24 and the slope is 0.03. What is the predicted number of labor hours for moving 484 cubic feet? Hint: Provide your answer accurate to 2 decimal places.arrow_forward
 Linear Algebra: A Modern IntroductionAlgebraISBN:9781285463247Author:David PoolePublisher:Cengage Learning
 Glencoe Algebra 1, Student Edition, 9780079039897...AlgebraISBN:9780079039897Author:CarterPublisher:McGraw Hill