
Concept explainers
Videos
Cost Behaviour; High4æw Method; Contribution Format Income Statement LOS−10
Morrisey& Brown, Ltd of Sydney j a merchandising company that is the sole distributor product that is increasing in popularity among Australian consumers, The Company’s income statements for the three most recent months follow: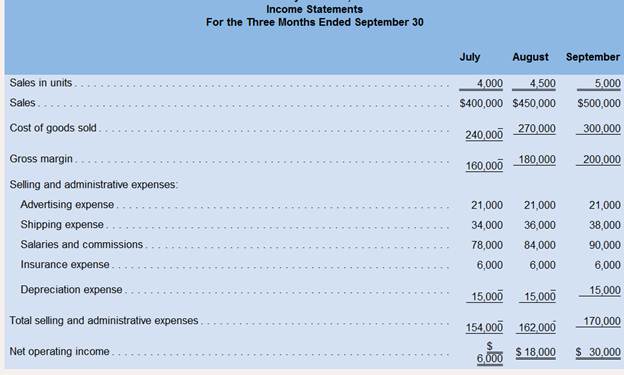
Required:
1. By ana1vzm the data from the company’s income statements, classify each of its expenses (including cost of goods sold) as either variable, fixed, or mixed.
2. Using the high-low method, separate each mixed expense into variable and fixed elements. Express the variable and fed portions of each mixed expense in the form Y = a + bX.
3. Redo the company’s income statement at the 5,000-unit level of activity using the contribution format.
High−Low Method: It is one of the methods distribution of cost used to split the mixed cost into fixed cost and variable cost.
1. The classification of expenses into variable, fixed, or mixed from the data given in the income statement.
2. The variable and fixed elements from the mixed expenses using the high-low method.
3. The contribution format income statement at the 5,000 unit level of activity.
Answer to Problem 7P
Solution:
1.
| Expenses | Classification |
| Cost of goods sold | Variable |
| Advertising expenses | Fixed |
| Shipping expenses | Mixed |
| Salaries and commissions | Mixed |
| Insurance expense | Fixed |
| Depreciation expenses | Fixed |
2. The total cost equation for shipping expenses is
The total cost equation for Salaries and Commissions is
3.
| Morrisey & Brown, Ltd
Contribution Format Income Statement | ||
| Sales | $500,000 | |
| Variable expenses: | ||
| Cost of goods sold | $300,000 | |
| Shipping expenses | $20,000 | |
| Salaries and commissions | $60,000 | |
| Total variable expenses | $380,000 | |
| Contribution margin | $120,000 | |
| Fixed expenses: | ||
| Advertising expenses | $21,000 | |
| Shipping expenses | $18,000 | |
| Salaries and commissions | $30,000 | |
| Insurance expenses | $6,000 | |
| Depreciation expenses | $15,000 | |
| Total fixed expenses | $90,000 | |
| Net operating income | $30,000 | |
Explanation of Solution
1. If the total amount of any expenses does not changes at different level of sales, it is a fixed expenses and if the total amount of any expenses changes at different level of sales, it is a variable expenses or mixed expenses. The combination of fixed and variable expenses is called a mixed expense.
2.
Applying High-low method to Shipping expenses (Mixed expenses)
| Units | Shipping
Expenses | |
| High Activity level | 5,000 | $38,000 |
| Low Activity level | 4,000 | $34,000 |
| Change | 1,000 | $4,000 |
Computation of Fixed cost at highest level of activity
Applying High-low method to Salaries and commissions expenses (Mixed expenses)
| Units | Shipping
Expenses | |
| High Activity level | 5,000 | $90,000 |
| Lowest Activity level | 4,000 | $78,000 |
| Change | 1,000 | $12,000 |
Computation of fixed cost at highest level of activity
3. The mixed expenses are distributed according to the variable and fixed elements based upon the figures computed by High-low Method. The variable expenses are $4 for shipping expenses and $12 for salaries and commissions. The fixed expenses are $18,000 for shipping expenses and $30,000 for salaries and commissions. The fixed expenses and variable expenses per unit will always remain the same for any level of sale.
Given:
| Morrisey & Brown, Ltd.
Income Statements For the Three Ended September 30 | |||
| Sales units | 4,000 | 4,500 | 5,000 |
| Sales | $400,000 | $450,000 | $500,000 |
| Cost of goods sold | $240,000 | $270,000 | $300,000 |
| Gross margin | $160,000 | $180,000 | $200,000 |
| Selling and administrative expenses: | |||
| Advertising expenses | $21,000 | $21,000 | $21,000 |
| Shipping expenses | $34,000 | $36,000 | $38,000 |
| Salaries and commissions | $78,000 | $84,000 | $90,000 |
| Insurance expenses | $6,000 | $6,000 | $6,000 |
| Depreciation expenses | $15,000 | $15,000 | $15,000 |
| Total selling and administrative expenses | $154,000 | $162,000 | $170,000 |
| Net operating income | $6,000 | $18,000 | $30,000 |
It is concluded that the Morrisey & Brown, have two mixed expenses which are shipping expenses and salaries expenses. A mixed expense can be identified by finding the change in percentage of the expense. Usually a variable expenses changes according to the change in the sales. So it means that the percentage change in sales will always be equal to percentage change in variable expenses. Hence if the percentage change in an expense is not equal to percentage change in sales, it is known as a mixed expenses.
Want to see more full solutions like this?
Chapter 6 Solutions
Introduction To Managerial Accounting


- Variable-Costing and Absorption-Costing Income Borques Company produces and sells wooden pallets that are used for moving and stacking materials. The operating costs for the past year were as follows: During the year, Borques produced 200,000 wooden pallets and sold 204,300 at 9 each. Borques had 8,200 pallets in beginning finished goods inventory; costs have not changed from last year to this year. An actual costing system is used for product costing. Required: 1. What is the per-unit inventory cost that is acceptable for reporting on Borquess balance sheet at the end of the year ? How many units are in ending inventory? What is the total cost of ending inventory? 2. Calculate absorption-costing operating income. 3. CONCEPTUAL CONNECTION What would the per-unit inventory cost be under variable costing? Does this differ from the unit cost computed in Requirement 1? Why? 4. Calculate variable-costing operating income. 5. Suppose that Borques Company had sold 196,700 pallets during the year. What would absorption-costing operating income have been? Variable-costing operating income?arrow_forwardMorrisey & Brown, Limited, of Sydney is a merchandising company that is the sole distributor of a product that is increasing in popularity among Australian consumers. The company’s income statements for the three most recent months follow: Using the high-low method, separate each mixed expense into variable and fixed elements. Express the variable and fixed portions of each mixed expense in the form Y = a + bX.arrow_forwardPiedmont Company segments its business into two regions—North and South. The company prepared the contribution format segmented income statement as shown below: Required:1. Compute the companywide break-even point in dollar sales.2. Compute the break-even point in dollar sales for the North region.3. Compute the break-even point in dollar sales for the South region.arrow_forward
- Contribution Margin by Segment The following data are for Cabin Craft Apparel: East West Sales volume (units): Product XX 9,300 10,000 Product YY 6,100 12,900 Sales price: Product XX $18 $20 Product YY $23 $22 Variable cost per unit: Product XX $11 $11 Product YY $14 $14 a. Determine the contribution margin for Product YY.$fill in the blank 1 b. Determine the contribution margin for the West Region.$fill in the blank 2arrow_forwardPrepare a contribution margin format income statement; answer what-ifquestions Shown here is an income statement in the traditional format for a firm with a sales volume of 15,000 units:Revenues . . . . . . . . . . . . . . . . . . . . . . . . . . . . . . . . . . . . . . . . . . . . . . . . . . . . . . $105,000Cost of goods sold ($8,000 1 $3.60/unit) . . . . . . . . . . . . . . . . . . . . . . . . . . . . . . 62,000Gross profi t . . . . . . . . . . . . . . . . . . . . . . . . . . . . . . . . . . . . . . . . . . . . . . . . . . . . . $ 43,000Operating expenses:Selling ($1,500 1 $0.80/unit) . . . . . . . . . . . . . . . . . . . . . . . . . . . . . . . . . . . . . . 13,500Administration ($4,000 1 $0.50/unit) . . . . . . . . . . . . . . . . . . . . . . . . . . . . . . . . 11,500Operating income . . . . . . . . . . . . . . . . . . . . . . . . . . . . . . . . . . . . . . . . . . . . . . . . $ 18,000Required:a. Prepare an income statement in the contribution margin format.b. Calculate the…arrow_forwardRongon Company manufactures twotypes of product. Selected information is given below:FantasyJoySelling price per unit$25$150Variable expenses per unit$15$35Number of units sold annually20,0005,000Fixed expenses total $480,800 per year. Required: i.Assuming the sales mix given above, do the following: a. Prepare a contribution format income statement showing both dollar and percent columns for each product and for the company as a whole. b. Compute the break-even point in dollars for the company as awhole and the margin of safety in both dollars and percent.ii.The company has developed a new product to be called Delight. Assume that the company could sell 10,000 units at $65each. The variable expenses would be $58each. The company’s fixed expenses would not change. a. Prepare another contribution format income statement, including sales of the Samoan Delight (sales of the other two products would not change). b. Compute the company’s new break-even point in dollars and the new margin…arrow_forward
- Keep-or-Drop Decision Petoskey Company produces three products: Alanson, Boyne, and Conway. A segmented income statement, with amounts given in thousands, follows: Alanson Boyne Conway Total Sales revenue $1,280 $185 $360 $1,825 Less: Variable expenses 1,115 45 288 1,448 Contribution margin $165 $140 $72 $377 Less direct fixed expenses: Depreciation 50 15 12 77 Salaries 95 85 84 264 Segment margin $20 $40 $(24) $36 Direct fixed expenses consist of depreciation and plant supervisory salaries. All depreciation on the equipment is dedicated to the product lines. None of the equipment can be sold. Assume that each of the three products has a different supervisor whose position would be eliminated if the associated product were dropped. Required: Conceptual Connection: Estimate the impact on profit that would result from dropping Conway. Enter amount in full, rather than in thousands. For example,…arrow_forwardPrepare a contribution margin format income statement; answer what-ifquestions Shown here is an income statement in the traditional format for a firm with a sales volume of 20,000 units. Cost formulas also are shown:Revenues . . . . . . . . . . . . . . . . . . . . . . . . . . . . . . . . . . . . . . . . . . . . . . . . . . . . . . . $200,000Cost of goods sold ($36,000 1 $5.20/unit) . . . . . . . . . . . . . . . . . . . . . . . . . . . . . . 140,000Gross profi t . . . . . . . . . . . . . . . . . . . . . . . . . . . . . . . . . . . . . . . . . . . . . . . . . . . . . . $ 60,000Operating expenses:Selling ($9,200 1 $0.30/unit) . . . . . . . . . . . . . . . . . . . . . . . . . . . . . . . . . . . . . . . 15,200Administration ($18,800 1 $0.50/unit) . . . . . . . . . . . . . . . . . . . . . . . . . . . . . . . . 28,800Operating income . . . . . . . . . . . . . . . . . . . . . . . . . . . . . . . . . . . . . . . . . . . . . . . . . $ 16,000Required:a. Prepare an income statement in the…arrow_forwardHigh-Low Method; Contribution Format Income Statement Milden Company is a distributor who wants to start using a contribution format income statement for planning purposes. The company has analyzed its expenses and developed the following cost formulas: Because shipping expense is a mixed cost, the company needs to estimate the variable shipping expense per unit sold and the fixed shipping expense per quarter using the following data: Required: 1. Using the high-low method, estimate a cost formula for shipping expense in the form Y = a + bX. 2. In the first quarter of Year 3, the company plans to sell 12,000 units at a selling price of $ 100 per unit. Prepare a contribution format income statement for the quarter.arrow_forward
- Print Item Question Content Area Contribution Margin, Break-Even Sales, Cost-Volume-Profit Chart, Margin of Safety, and Operating Leverage Wolsey Industries Inc. expects to maintain the same inventories at the end of 20Y3 as at the beginning of the year. The total of all production costs for the year is therefore assumed to be equal to the cost of goods sold. With this in mind, the various department heads were asked to submit estimates of the costs for their departments during the year. A summary report of these estimates is as follows: EstimatedFixed Cost Estimated Variable Cost(per unit sold) Production costs: Direct materials — $46 Direct labor — 40 Factory overhead $200,000 20 Selling expenses: Sales salaries and commissions 110,000 8 Advertising 40,000 — Travel 12,000 — Miscellaneous selling expense 7,600 1 Administrative expenses: Office and…arrow_forwardHudson Company reports the following contribution margin income statement. Hudson Company reports the following contribution margin income statement.A manufacturer's contribution margin income statement for the yearfollows. Required: Prepare a contribution margin income statement if the number of units sold (a) increases by 200 units and (b) decreases by 200 units. HUDSON COMPANY Contribution Margin Income Statement For Year EndeDecember 31 Required: 1. Assume Hudson has a target income of $162,000. What amount of sales dollars is needed to produce this target income? 2. If Hudson achieves its target income, what is its margin of safety (in percent) ?Margin of safetyarrow_forwardKeep-or-Drop Decision Charlevoix Company produces three products: Torch, Elk, and Walloon. A segmented income statement, with amounts given in thousands, follows: Line Item Description Torch Elk Walloon Total Sales revenue $1,280 $185 $315 $1,780 Less: Variable expenses 1,115 45 252 1,412 Contribution margin $165 $140 $63 $368 Less direct fixed expenses: Depreciation 50 15 10 75 Advertising 95 85 76 256 Segment margin $20 $40 $(23) $37 Direct fixed expenses consist of depreciation and advertising. All depreciation on the equipment is dedicated to the product lines. None of the equipment can be sold. Assume that, each of the three products has a different marketing campaign whose advertising would be eliminated if the associated product were dropped. Assume that 30% of the Torch customers choose to buy from Charlevoix because it offers a full range of products, including Walloon. If Walloon were no longer available from Charlevoix, these customers…arrow_forward
 Financial Reporting, Financial Statement Analysis...FinanceISBN:9781285190907Author:James M. Wahlen, Stephen P. Baginski, Mark BradshawPublisher:Cengage Learning
 Managerial AccountingAccountingISBN:9781337912020Author:Carl Warren, Ph.d. Cma William B. TaylerPublisher:South-Western College Pub
 Managerial Accounting: The Cornerstone of Busines...AccountingISBN:9781337115773Author:Maryanne M. Mowen, Don R. Hansen, Dan L. HeitgerPublisher:Cengage Learning
 Principles of Accounting Volume 2AccountingISBN:9781947172609Author:OpenStaxPublisher:OpenStax College