
Videos
To Draw:
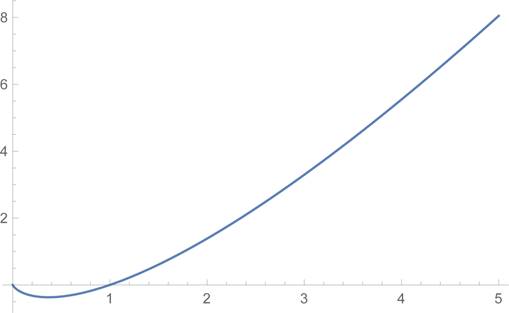
Graph of the function
Solution:
The graph is sketched below.
Given:
Explanation:
Consider, the function
(1) Domain of the function y:
Domain of
Domain of
Thus, domain of
(2) Intercepts:
There is no y-intercept as x = 0 is not in domain of y.
For x-intercept, put
But x > 0, therefore
(3)
This implies that y is neither even nor odd function.
(4) Asymptotes:
Since
This shows that at x =0, y has no vertical asymptote.
Horizontal asymptotes:
Thus, y has no horizontal asymptotes..
(5) Increasing or decreasing:
Consider
Differentiate it with respect to x, we get
Put
Consider
| Interval | Point in the interval | Value of |
Sign of |
Increasing or decreasing |
| Decreasing | ||||
| Increasing |
This implies that
(6) Local maxima or minima:
Consider
Differentiate it with respect to x, we get
At
Therefore,
(7) Inflection point:
Since
Thus, by the above information’s graph of y is:
Want to see the full answer?
Check out a sample textbook solution
Chapter 6 Solutions
Calculus (MindTap Course List)


 Algebra & Trigonometry with Analytic GeometryAlgebraISBN:9781133382119Author:SwokowskiPublisher:Cengage
 Trigonometry (MindTap Course List)TrigonometryISBN:9781305652224Author:Charles P. McKeague, Mark D. TurnerPublisher:Cengage Learning